Scotch-Irish vs Pakistani Householder Income Over 65 years
COMPARE
Scotch-Irish
Pakistani
Householder Income Over 65 years
Householder Income Over 65 years Comparison
Scotch-Irish
Pakistanis
$59,447
HOUSEHOLDER INCOME OVER 65 YEARS
16.9/ 100
METRIC RATING
203rd/ 347
METRIC RANK
$63,844
HOUSEHOLDER INCOME OVER 65 YEARS
95.3/ 100
METRIC RATING
107th/ 347
METRIC RANK
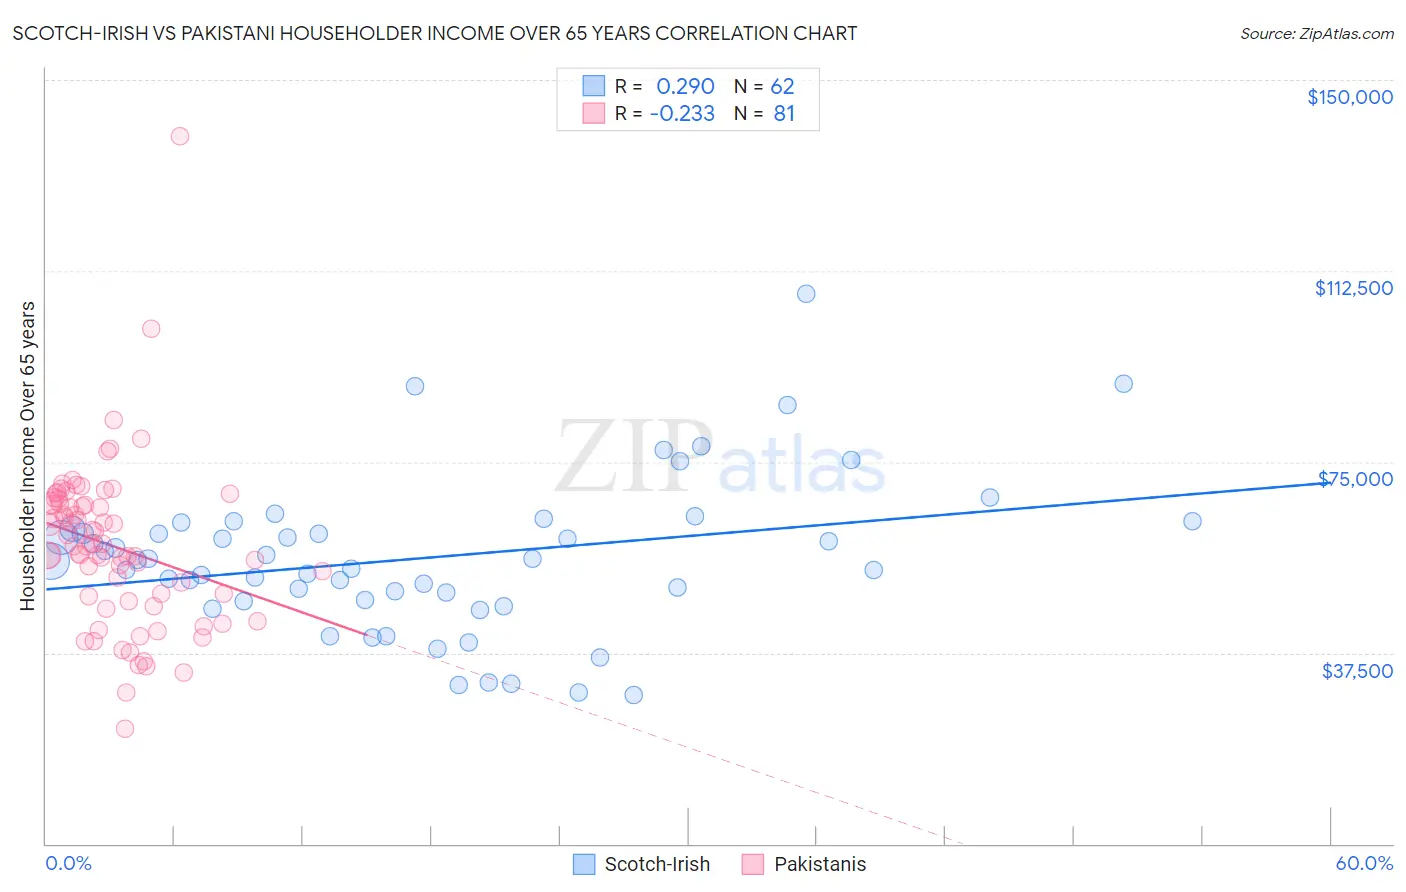
Scotch-Irish vs Pakistani Householder Income Over 65 years Correlation Chart
The statistical analysis conducted on geographies consisting of 544,677,827 people shows a weak positive correlation between the proportion of Scotch-Irish and household income with householder over the age of 65 in the United States with a correlation coefficient (R) of 0.290 and weighted average of $59,447. Similarly, the statistical analysis conducted on geographies consisting of 334,349,406 people shows a weak negative correlation between the proportion of Pakistanis and household income with householder over the age of 65 in the United States with a correlation coefficient (R) of -0.233 and weighted average of $63,844, a difference of 7.4%.
Householder Income Over 65 years Correlation Summary
| Measurement | Scotch-Irish | Pakistani |
| Minimum | $29,123 | $22,611 |
| Maximum | $108,125 | $139,000 |
| Range | $79,002 | $116,389 |
| Mean | $56,120 | $58,427 |
| Median | $55,574 | $58,443 |
| Interquartile 25% (IQ1) | $47,845 | $48,104 |
| Interquartile 75% (IQ3) | $61,936 | $66,893 |
| Interquartile Range (IQR) | $14,091 | $18,789 |
| Standard Deviation (Sample) | $15,113 | $16,214 |
| Standard Deviation (Population) | $14,991 | $16,114 |
Similar Demographics by Householder Income Over 65 years
Demographics Similar to Scotch-Irish by Householder Income Over 65 years
In terms of householder income over 65 years, the demographic groups most similar to Scotch-Irish are Arapaho ($59,383, a difference of 0.11%), Dutch ($59,539, a difference of 0.15%), Finnish ($59,535, a difference of 0.15%), Immigrants from Sudan ($59,248, a difference of 0.34%), and Immigrants ($59,656, a difference of 0.35%).
| Demographics | Rating | Rank | Householder Income Over 65 years |
| Germans | 21.5 /100 | #196 | Fair $59,730 |
| Immigrants | Kenya | 21.1 /100 | #197 | Fair $59,710 |
| Moroccans | 20.7 /100 | #198 | Fair $59,683 |
| Immigrants | Immigrants | 20.2 /100 | #199 | Fair $59,656 |
| French | 20.2 /100 | #200 | Fair $59,656 |
| Dutch | 18.3 /100 | #201 | Poor $59,539 |
| Finns | 18.2 /100 | #202 | Poor $59,535 |
| Scotch-Irish | 16.9 /100 | #203 | Poor $59,447 |
| Arapaho | 16.0 /100 | #204 | Poor $59,383 |
| Immigrants | Sudan | 14.2 /100 | #205 | Poor $59,248 |
| Immigrants | South America | 13.0 /100 | #206 | Poor $59,151 |
| Salvadorans | 12.9 /100 | #207 | Poor $59,141 |
| Uruguayans | 12.3 /100 | #208 | Poor $59,090 |
| Slovaks | 11.7 /100 | #209 | Poor $59,039 |
| Nigerians | 11.2 /100 | #210 | Poor $58,992 |
Demographics Similar to Pakistanis by Householder Income Over 65 years
In terms of householder income over 65 years, the demographic groups most similar to Pakistanis are Italian ($63,885, a difference of 0.060%), Immigrants from Argentina ($63,885, a difference of 0.060%), Palestinian ($63,800, a difference of 0.070%), Immigrants from Cameroon ($63,907, a difference of 0.10%), and European ($63,779, a difference of 0.10%).
| Demographics | Rating | Rank | Householder Income Over 65 years |
| Immigrants | South Eastern Asia | 96.3 /100 | #100 | Exceptional $64,089 |
| Immigrants | Italy | 96.2 /100 | #101 | Exceptional $64,065 |
| Chileans | 95.8 /100 | #102 | Exceptional $63,957 |
| British | 95.7 /100 | #103 | Exceptional $63,940 |
| Immigrants | Cameroon | 95.6 /100 | #104 | Exceptional $63,907 |
| Italians | 95.5 /100 | #105 | Exceptional $63,885 |
| Immigrants | Argentina | 95.5 /100 | #106 | Exceptional $63,885 |
| Pakistanis | 95.3 /100 | #107 | Exceptional $63,844 |
| Palestinians | 95.1 /100 | #108 | Exceptional $63,800 |
| Europeans | 95.0 /100 | #109 | Exceptional $63,779 |
| Immigrants | Zimbabwe | 94.3 /100 | #110 | Exceptional $63,643 |
| Immigrants | Spain | 93.7 /100 | #111 | Exceptional $63,540 |
| Syrians | 93.4 /100 | #112 | Exceptional $63,494 |
| Immigrants | Serbia | 92.7 /100 | #113 | Exceptional $63,387 |
| Immigrants | Saudi Arabia | 92.4 /100 | #114 | Exceptional $63,355 |