Scotch-Irish vs Cambodian Householder Income Over 65 years
COMPARE
Scotch-Irish
Cambodian
Householder Income Over 65 years
Householder Income Over 65 years Comparison
Scotch-Irish
Cambodians
$59,447
HOUSEHOLDER INCOME OVER 65 YEARS
16.9/ 100
METRIC RATING
203rd/ 347
METRIC RANK
$66,892
HOUSEHOLDER INCOME OVER 65 YEARS
99.8/ 100
METRIC RATING
46th/ 347
METRIC RANK
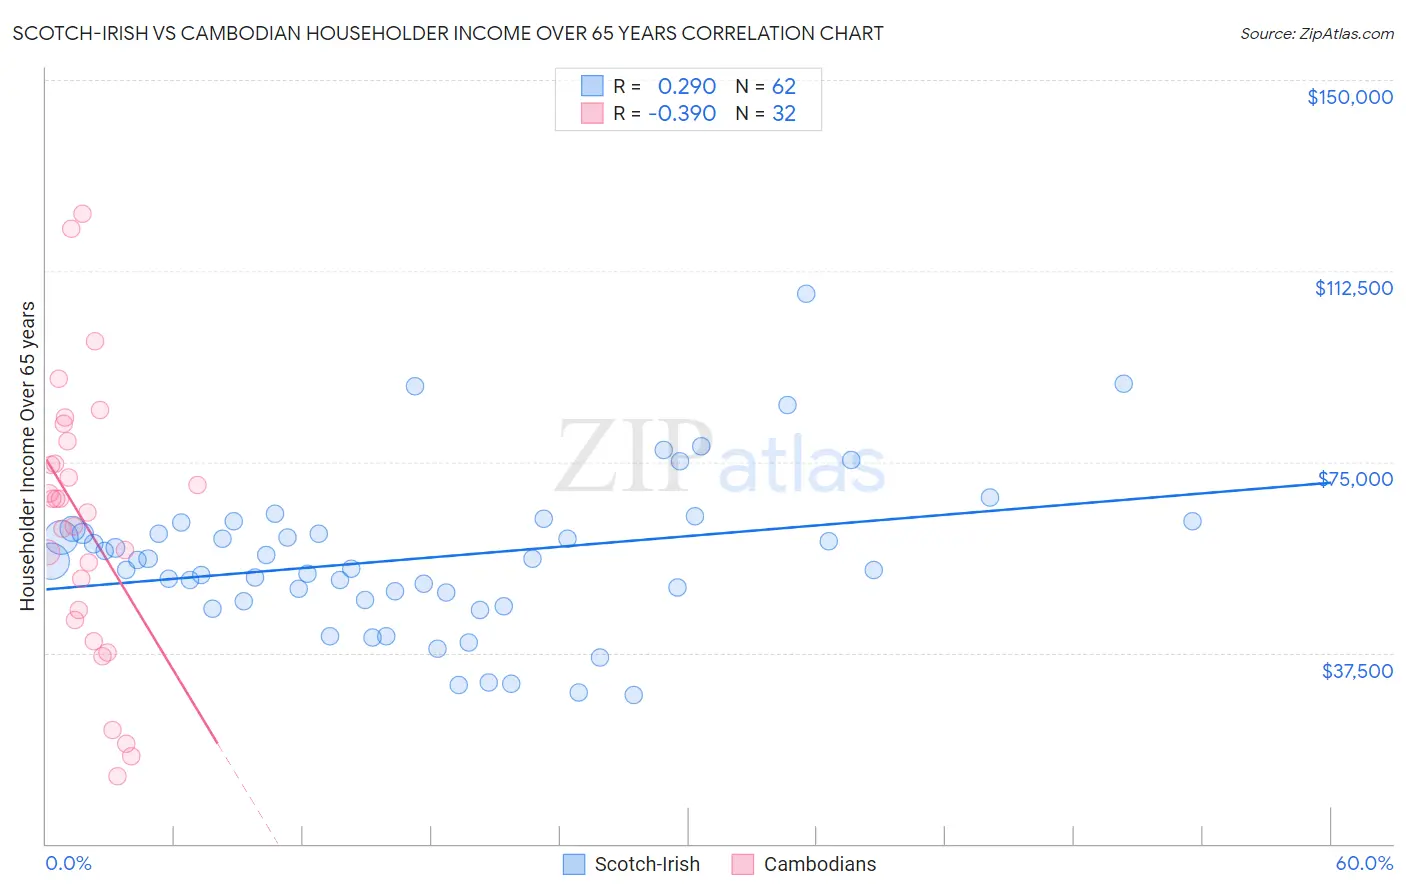
Scotch-Irish vs Cambodian Householder Income Over 65 years Correlation Chart
The statistical analysis conducted on geographies consisting of 544,677,827 people shows a weak positive correlation between the proportion of Scotch-Irish and household income with householder over the age of 65 in the United States with a correlation coefficient (R) of 0.290 and weighted average of $59,447. Similarly, the statistical analysis conducted on geographies consisting of 102,372,212 people shows a mild negative correlation between the proportion of Cambodians and household income with householder over the age of 65 in the United States with a correlation coefficient (R) of -0.390 and weighted average of $66,892, a difference of 12.5%.
Householder Income Over 65 years Correlation Summary
| Measurement | Scotch-Irish | Cambodian |
| Minimum | $29,123 | $13,250 |
| Maximum | $108,125 | $123,750 |
| Range | $79,002 | $110,500 |
| Mean | $56,120 | $63,009 |
| Median | $55,574 | $66,420 |
| Interquartile 25% (IQ1) | $47,845 | $44,945 |
| Interquartile 75% (IQ3) | $61,936 | $76,799 |
| Interquartile Range (IQR) | $14,091 | $31,853 |
| Standard Deviation (Sample) | $15,113 | $26,681 |
| Standard Deviation (Population) | $14,991 | $26,261 |
Similar Demographics by Householder Income Over 65 years
Demographics Similar to Scotch-Irish by Householder Income Over 65 years
In terms of householder income over 65 years, the demographic groups most similar to Scotch-Irish are Arapaho ($59,383, a difference of 0.11%), Dutch ($59,539, a difference of 0.15%), Finnish ($59,535, a difference of 0.15%), Immigrants from Sudan ($59,248, a difference of 0.34%), and Immigrants ($59,656, a difference of 0.35%).
| Demographics | Rating | Rank | Householder Income Over 65 years |
| Germans | 21.5 /100 | #196 | Fair $59,730 |
| Immigrants | Kenya | 21.1 /100 | #197 | Fair $59,710 |
| Moroccans | 20.7 /100 | #198 | Fair $59,683 |
| Immigrants | Immigrants | 20.2 /100 | #199 | Fair $59,656 |
| French | 20.2 /100 | #200 | Fair $59,656 |
| Dutch | 18.3 /100 | #201 | Poor $59,539 |
| Finns | 18.2 /100 | #202 | Poor $59,535 |
| Scotch-Irish | 16.9 /100 | #203 | Poor $59,447 |
| Arapaho | 16.0 /100 | #204 | Poor $59,383 |
| Immigrants | Sudan | 14.2 /100 | #205 | Poor $59,248 |
| Immigrants | South America | 13.0 /100 | #206 | Poor $59,151 |
| Salvadorans | 12.9 /100 | #207 | Poor $59,141 |
| Uruguayans | 12.3 /100 | #208 | Poor $59,090 |
| Slovaks | 11.7 /100 | #209 | Poor $59,039 |
| Nigerians | 11.2 /100 | #210 | Poor $58,992 |
Demographics Similar to Cambodians by Householder Income Over 65 years
In terms of householder income over 65 years, the demographic groups most similar to Cambodians are Australian ($66,891, a difference of 0.0%), Immigrants from France ($66,826, a difference of 0.10%), Immigrants from Afghanistan ($67,007, a difference of 0.17%), Immigrants from Indonesia ($66,694, a difference of 0.30%), and Immigrants from Turkey ($66,672, a difference of 0.33%).
| Demographics | Rating | Rank | Householder Income Over 65 years |
| Russians | 99.9 /100 | #39 | Exceptional $67,626 |
| Immigrants | Asia | 99.9 /100 | #40 | Exceptional $67,594 |
| Koreans | 99.9 /100 | #41 | Exceptional $67,472 |
| New Zealanders | 99.9 /100 | #42 | Exceptional $67,333 |
| Latvians | 99.9 /100 | #43 | Exceptional $67,326 |
| Immigrants | South Africa | 99.9 /100 | #44 | Exceptional $67,234 |
| Immigrants | Afghanistan | 99.8 /100 | #45 | Exceptional $67,007 |
| Cambodians | 99.8 /100 | #46 | Exceptional $66,892 |
| Australians | 99.8 /100 | #47 | Exceptional $66,891 |
| Immigrants | France | 99.8 /100 | #48 | Exceptional $66,826 |
| Immigrants | Indonesia | 99.8 /100 | #49 | Exceptional $66,694 |
| Immigrants | Turkey | 99.7 /100 | #50 | Exceptional $66,672 |
| Israelis | 99.7 /100 | #51 | Exceptional $66,636 |
| Immigrants | Scotland | 99.7 /100 | #52 | Exceptional $66,620 |
| Immigrants | Pakistan | 99.7 /100 | #53 | Exceptional $66,617 |