Scotch-Irish vs Afghan No Schooling Completed
COMPARE
Scotch-Irish
Afghan
No Schooling Completed
No Schooling Completed Comparison
Scotch-Irish
Afghans
1.5%
NO SCHOOLING COMPLETED
100.0/ 100
METRIC RATING
14th/ 347
METRIC RANK
2.6%
NO SCHOOLING COMPLETED
0.1/ 100
METRIC RATING
281st/ 347
METRIC RANK
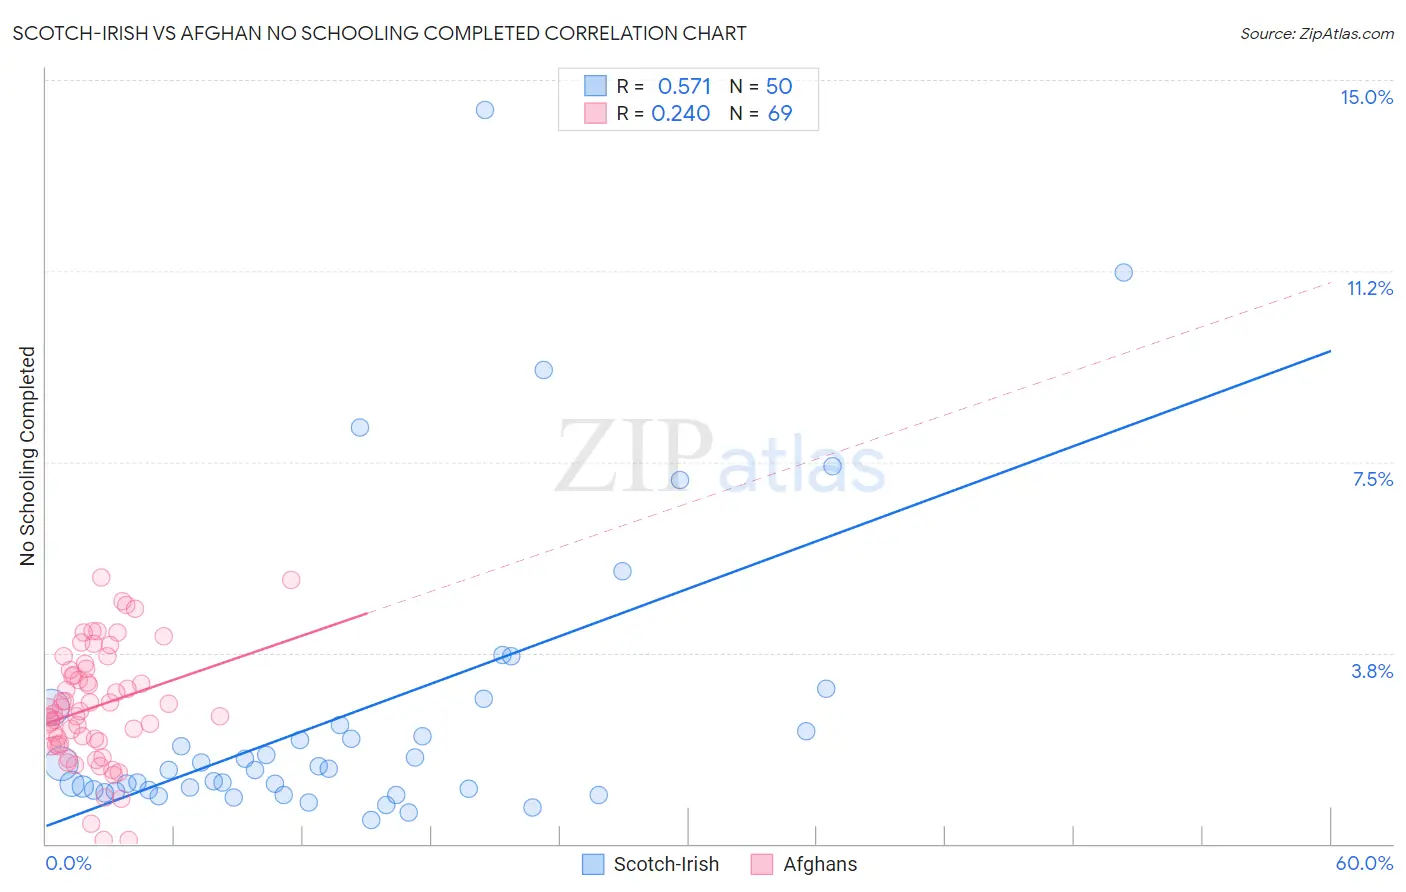
Scotch-Irish vs Afghan No Schooling Completed Correlation Chart
The statistical analysis conducted on geographies consisting of 532,641,930 people shows a substantial positive correlation between the proportion of Scotch-Irish and percentage of population with no schooling in the United States with a correlation coefficient (R) of 0.571 and weighted average of 1.5%. Similarly, the statistical analysis conducted on geographies consisting of 148,452,178 people shows a weak positive correlation between the proportion of Afghans and percentage of population with no schooling in the United States with a correlation coefficient (R) of 0.240 and weighted average of 2.6%, a difference of 79.2%.
No Schooling Completed Correlation Summary
| Measurement | Scotch-Irish | Afghan |
| Minimum | 0.46% | 0.074% |
| Maximum | 14.4% | 5.2% |
| Range | 14.0% | 5.2% |
| Mean | 2.6% | 2.7% |
| Median | 1.5% | 2.6% |
| Interquartile 25% (IQ1) | 1.0% | 1.9% |
| Interquartile 75% (IQ3) | 2.3% | 3.4% |
| Interquartile Range (IQR) | 1.3% | 1.5% |
| Standard Deviation (Sample) | 2.9% | 1.1% |
| Standard Deviation (Population) | 2.9% | 1.1% |
Similar Demographics by No Schooling Completed
Demographics Similar to Scotch-Irish by No Schooling Completed
In terms of no schooling completed, the demographic groups most similar to Scotch-Irish are Tlingit-Haida (1.5%, a difference of 0.060%), Finnish (1.5%, a difference of 0.58%), Croatian (1.5%, a difference of 0.59%), Danish (1.5%, a difference of 0.89%), and Polish (1.4%, a difference of 0.94%).
| Demographics | Rating | Rank | No Schooling Completed |
| English | 100.0 /100 | #7 | Exceptional 1.4% |
| Swedes | 100.0 /100 | #8 | Exceptional 1.4% |
| Scottish | 100.0 /100 | #9 | Exceptional 1.4% |
| Dutch | 100.0 /100 | #10 | Exceptional 1.4% |
| Lithuanians | 100.0 /100 | #11 | Exceptional 1.4% |
| Irish | 100.0 /100 | #12 | Exceptional 1.4% |
| Poles | 100.0 /100 | #13 | Exceptional 1.4% |
| Scotch-Irish | 100.0 /100 | #14 | Exceptional 1.5% |
| Tlingit-Haida | 100.0 /100 | #15 | Exceptional 1.5% |
| Finns | 100.0 /100 | #16 | Exceptional 1.5% |
| Croatians | 100.0 /100 | #17 | Exceptional 1.5% |
| Danes | 100.0 /100 | #18 | Exceptional 1.5% |
| Alaskan Athabascans | 100.0 /100 | #19 | Exceptional 1.5% |
| Welsh | 100.0 /100 | #20 | Exceptional 1.5% |
| Chinese | 100.0 /100 | #21 | Exceptional 1.5% |
Demographics Similar to Afghans by No Schooling Completed
In terms of no schooling completed, the demographic groups most similar to Afghans are Trinidadian and Tobagonian (2.6%, a difference of 0.080%), Barbadian (2.6%, a difference of 0.10%), Immigrants from Ghana (2.6%, a difference of 0.20%), Immigrants from Uzbekistan (2.6%, a difference of 0.64%), and Immigrants from Philippines (2.6%, a difference of 0.84%).
| Demographics | Rating | Rank | No Schooling Completed |
| Ghanaians | 0.1 /100 | #274 | Tragic 2.6% |
| Immigrants | China | 0.1 /100 | #275 | Tragic 2.6% |
| Immigrants | Western Africa | 0.1 /100 | #276 | Tragic 2.6% |
| Immigrants | Philippines | 0.1 /100 | #277 | Tragic 2.6% |
| Immigrants | Uzbekistan | 0.1 /100 | #278 | Tragic 2.6% |
| Barbadians | 0.1 /100 | #279 | Tragic 2.6% |
| Trinidadians and Tobagonians | 0.1 /100 | #280 | Tragic 2.6% |
| Afghans | 0.1 /100 | #281 | Tragic 2.6% |
| Immigrants | Ghana | 0.1 /100 | #282 | Tragic 2.6% |
| Immigrants | Trinidad and Tobago | 0.0 /100 | #283 | Tragic 2.6% |
| Immigrants | West Indies | 0.0 /100 | #284 | Tragic 2.7% |
| Immigrants | Barbados | 0.0 /100 | #285 | Tragic 2.7% |
| Immigrants | Portugal | 0.0 /100 | #286 | Tragic 2.7% |
| Immigrants | Afghanistan | 0.0 /100 | #287 | Tragic 2.7% |
| Immigrants | St. Vincent and the Grenadines | 0.0 /100 | #288 | Tragic 2.7% |