Scotch-Irish vs Afghan Disability
COMPARE
Scotch-Irish
Afghan
Disability
Disability Comparison
Scotch-Irish
Afghans
13.3%
DISABILITY
0.0/ 100
METRIC RATING
303rd/ 347
METRIC RANK
10.8%
DISABILITY
99.9/ 100
METRIC RATING
38th/ 347
METRIC RANK
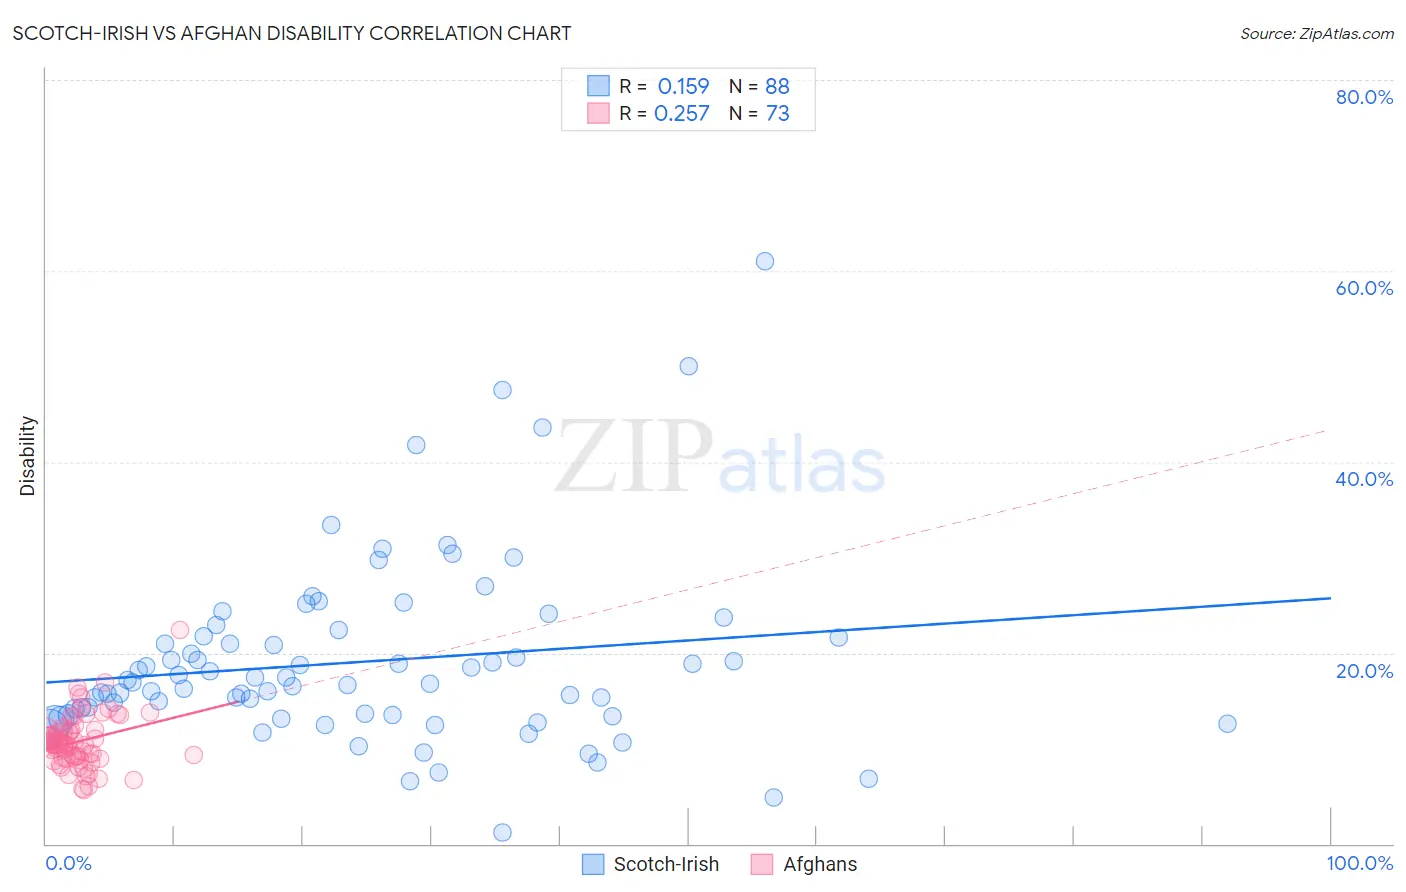
Scotch-Irish vs Afghan Disability Correlation Chart
The statistical analysis conducted on geographies consisting of 548,670,555 people shows a poor positive correlation between the proportion of Scotch-Irish and percentage of population with a disability in the United States with a correlation coefficient (R) of 0.159 and weighted average of 13.3%. Similarly, the statistical analysis conducted on geographies consisting of 148,869,641 people shows a weak positive correlation between the proportion of Afghans and percentage of population with a disability in the United States with a correlation coefficient (R) of 0.257 and weighted average of 10.8%, a difference of 23.8%.
Disability Correlation Summary
| Measurement | Scotch-Irish | Afghan |
| Minimum | 1.2% | 5.6% |
| Maximum | 61.0% | 22.3% |
| Range | 59.8% | 16.8% |
| Mean | 19.1% | 10.7% |
| Median | 16.8% | 10.4% |
| Interquartile 25% (IQ1) | 13.5% | 9.1% |
| Interquartile 75% (IQ3) | 21.7% | 11.9% |
| Interquartile Range (IQR) | 8.2% | 2.8% |
| Standard Deviation (Sample) | 9.6% | 2.8% |
| Standard Deviation (Population) | 9.6% | 2.8% |
Similar Demographics by Disability
Demographics Similar to Scotch-Irish by Disability
In terms of disability, the demographic groups most similar to Scotch-Irish are Yakama (13.4%, a difference of 0.47%), Arapaho (13.2%, a difference of 0.78%), French Canadian (13.4%, a difference of 0.81%), Immigrants from Micronesia (13.2%, a difference of 0.99%), and Pennsylvania German (13.2%, a difference of 1.1%).
| Demographics | Rating | Rank | Disability |
| Central American Indians | 0.0 /100 | #296 | Tragic 13.2% |
| Hopi | 0.0 /100 | #297 | Tragic 13.2% |
| Alaska Natives | 0.0 /100 | #298 | Tragic 13.2% |
| French | 0.0 /100 | #299 | Tragic 13.2% |
| Pennsylvania Germans | 0.0 /100 | #300 | Tragic 13.2% |
| Immigrants | Micronesia | 0.0 /100 | #301 | Tragic 13.2% |
| Arapaho | 0.0 /100 | #302 | Tragic 13.2% |
| Scotch-Irish | 0.0 /100 | #303 | Tragic 13.3% |
| Yakama | 0.0 /100 | #304 | Tragic 13.4% |
| French Canadians | 0.0 /100 | #305 | Tragic 13.4% |
| Cape Verdeans | 0.0 /100 | #306 | Tragic 13.5% |
| Shoshone | 0.0 /100 | #307 | Tragic 13.5% |
| French American Indians | 0.0 /100 | #308 | Tragic 13.5% |
| Tlingit-Haida | 0.0 /100 | #309 | Tragic 13.5% |
| Blackfeet | 0.0 /100 | #310 | Tragic 13.6% |
Demographics Similar to Afghans by Disability
In terms of disability, the demographic groups most similar to Afghans are Cambodian (10.8%, a difference of 0.10%), Mongolian (10.8%, a difference of 0.10%), Immigrants from Australia (10.8%, a difference of 0.15%), Immigrants from Nepal (10.8%, a difference of 0.25%), and Israeli (10.8%, a difference of 0.29%).
| Demographics | Rating | Rank | Disability |
| Immigrants | Egypt | 100.0 /100 | #31 | Exceptional 10.6% |
| Paraguayans | 100.0 /100 | #32 | Exceptional 10.6% |
| Immigrants | Kuwait | 100.0 /100 | #33 | Exceptional 10.7% |
| Immigrants | Ethiopia | 100.0 /100 | #34 | Exceptional 10.7% |
| Immigrants | Indonesia | 100.0 /100 | #35 | Exceptional 10.7% |
| Ethiopians | 100.0 /100 | #36 | Exceptional 10.7% |
| Turks | 100.0 /100 | #37 | Exceptional 10.7% |
| Afghans | 99.9 /100 | #38 | Exceptional 10.8% |
| Cambodians | 99.9 /100 | #39 | Exceptional 10.8% |
| Mongolians | 99.9 /100 | #40 | Exceptional 10.8% |
| Immigrants | Australia | 99.9 /100 | #41 | Exceptional 10.8% |
| Immigrants | Nepal | 99.9 /100 | #42 | Exceptional 10.8% |
| Israelis | 99.9 /100 | #43 | Exceptional 10.8% |
| Immigrants | Japan | 99.9 /100 | #44 | Exceptional 10.8% |
| Immigrants | Peru | 99.9 /100 | #45 | Exceptional 10.8% |