Scotch-Irish vs Afghan Median Female Earnings
COMPARE
Scotch-Irish
Afghan
Median Female Earnings
Median Female Earnings Comparison
Scotch-Irish
Afghans
$37,383
MEDIAN FEMALE EARNINGS
0.8/ 100
METRIC RATING
259th/ 347
METRIC RANK
$43,077
MEDIAN FEMALE EARNINGS
99.9/ 100
METRIC RATING
62nd/ 347
METRIC RANK
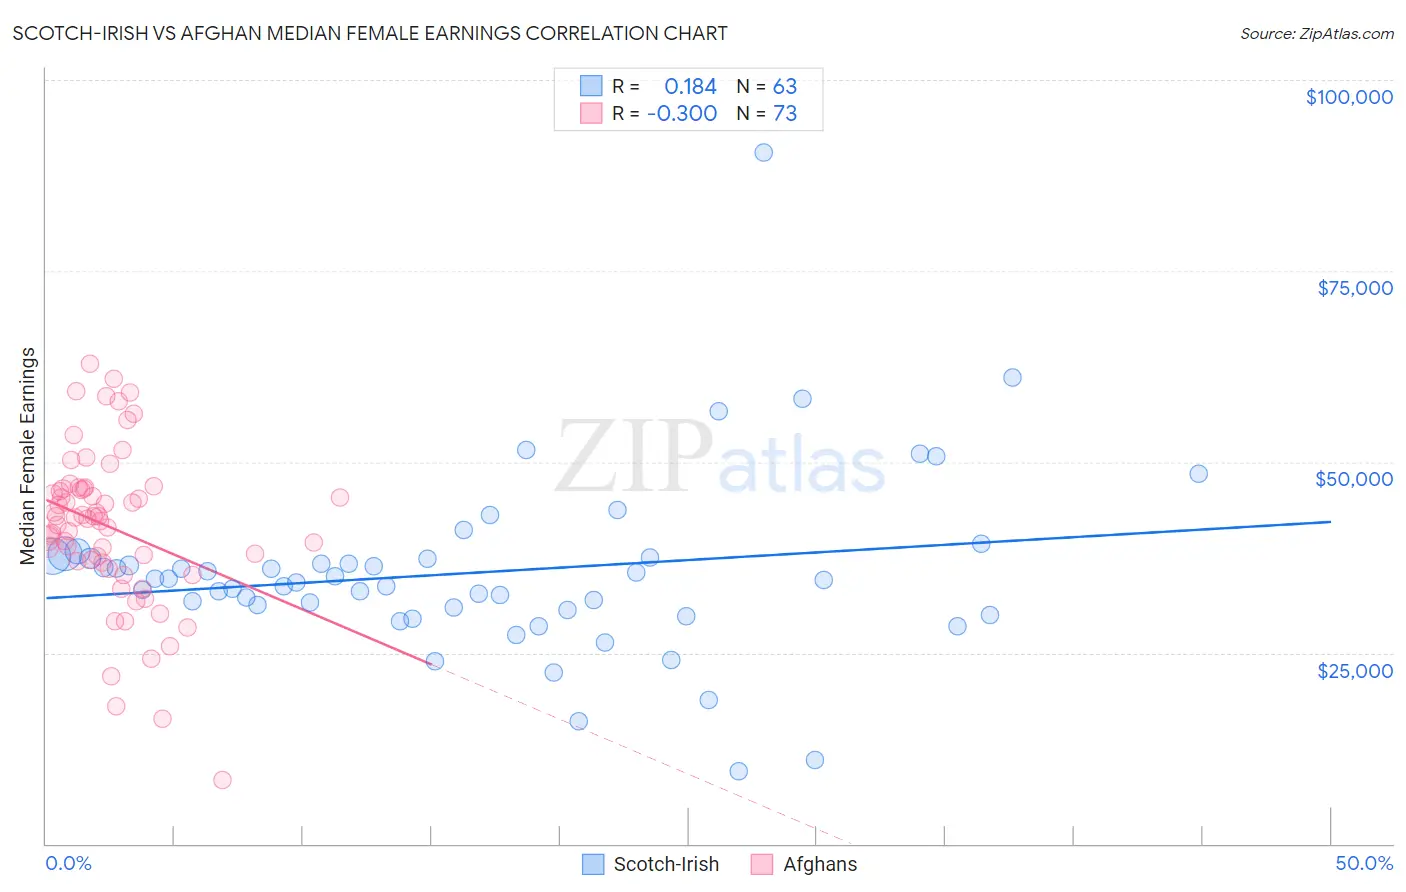
Scotch-Irish vs Afghan Median Female Earnings Correlation Chart
The statistical analysis conducted on geographies consisting of 547,379,253 people shows a poor positive correlation between the proportion of Scotch-Irish and median female earnings in the United States with a correlation coefficient (R) of 0.184 and weighted average of $37,383. Similarly, the statistical analysis conducted on geographies consisting of 148,870,057 people shows a mild negative correlation between the proportion of Afghans and median female earnings in the United States with a correlation coefficient (R) of -0.300 and weighted average of $43,077, a difference of 15.2%.
Median Female Earnings Correlation Summary
| Measurement | Scotch-Irish | Afghan |
| Minimum | $9,426 | $8,380 |
| Maximum | $90,469 | $62,780 |
| Range | $81,043 | $54,400 |
| Mean | $35,513 | $41,426 |
| Median | $34,550 | $42,748 |
| Interquartile 25% (IQ1) | $30,536 | $36,907 |
| Interquartile 75% (IQ3) | $37,534 | $46,506 |
| Interquartile Range (IQR) | $6,998 | $9,599 |
| Standard Deviation (Sample) | $11,827 | $10,289 |
| Standard Deviation (Population) | $11,733 | $10,218 |
Similar Demographics by Median Female Earnings
Demographics Similar to Scotch-Irish by Median Female Earnings
In terms of median female earnings, the demographic groups most similar to Scotch-Irish are Belizean ($37,429, a difference of 0.12%), Dutch ($37,339, a difference of 0.12%), Malaysian ($37,298, a difference of 0.23%), Venezuelan ($37,282, a difference of 0.27%), and Samoan ($37,498, a difference of 0.31%).
| Demographics | Rating | Rank | Median Female Earnings |
| Immigrants | Dominica | 2.0 /100 | #252 | Tragic $37,825 |
| Danes | 1.6 /100 | #253 | Tragic $37,730 |
| Whites/Caucasians | 1.1 /100 | #254 | Tragic $37,531 |
| Colville | 1.1 /100 | #255 | Tragic $37,514 |
| Samoans | 1.0 /100 | #256 | Tragic $37,498 |
| Hawaiians | 1.0 /100 | #257 | Tragic $37,497 |
| Belizeans | 0.9 /100 | #258 | Tragic $37,429 |
| Scotch-Irish | 0.8 /100 | #259 | Tragic $37,383 |
| Dutch | 0.7 /100 | #260 | Tragic $37,339 |
| Malaysians | 0.7 /100 | #261 | Tragic $37,298 |
| Venezuelans | 0.7 /100 | #262 | Tragic $37,282 |
| German Russians | 0.5 /100 | #263 | Tragic $37,105 |
| Salvadorans | 0.4 /100 | #264 | Tragic $37,083 |
| Immigrants | Belize | 0.4 /100 | #265 | Tragic $37,056 |
| Dominicans | 0.4 /100 | #266 | Tragic $37,046 |
Demographics Similar to Afghans by Median Female Earnings
In terms of median female earnings, the demographic groups most similar to Afghans are Immigrants from Bulgaria ($43,085, a difference of 0.020%), Immigrants from Ukraine ($43,069, a difference of 0.020%), Immigrants from Latvia ($43,099, a difference of 0.050%), Immigrants from Pakistan ($43,052, a difference of 0.060%), and Estonian ($43,106, a difference of 0.070%).
| Demographics | Rating | Rank | Median Female Earnings |
| Egyptians | 99.9 /100 | #55 | Exceptional $43,305 |
| Immigrants | Croatia | 99.9 /100 | #56 | Exceptional $43,258 |
| Ethiopians | 99.9 /100 | #57 | Exceptional $43,243 |
| Paraguayans | 99.9 /100 | #58 | Exceptional $43,173 |
| Estonians | 99.9 /100 | #59 | Exceptional $43,106 |
| Immigrants | Latvia | 99.9 /100 | #60 | Exceptional $43,099 |
| Immigrants | Bulgaria | 99.9 /100 | #61 | Exceptional $43,085 |
| Afghans | 99.9 /100 | #62 | Exceptional $43,077 |
| Immigrants | Ukraine | 99.9 /100 | #63 | Exceptional $43,069 |
| Immigrants | Pakistan | 99.9 /100 | #64 | Exceptional $43,052 |
| Sierra Leoneans | 99.9 /100 | #65 | Exceptional $42,868 |
| Immigrants | Norway | 99.9 /100 | #66 | Exceptional $42,837 |
| Immigrants | Egypt | 99.9 /100 | #67 | Exceptional $42,837 |
| Immigrants | Austria | 99.8 /100 | #68 | Exceptional $42,824 |
| Immigrants | Spain | 99.8 /100 | #69 | Exceptional $42,815 |