Scotch-Irish vs Maltese Householder Income Over 65 years
COMPARE
Scotch-Irish
Maltese
Householder Income Over 65 years
Householder Income Over 65 years Comparison
Scotch-Irish
Maltese
$59,447
HOUSEHOLDER INCOME OVER 65 YEARS
16.9/ 100
METRIC RATING
203rd/ 347
METRIC RANK
$66,027
HOUSEHOLDER INCOME OVER 65 YEARS
99.5/ 100
METRIC RATING
61st/ 347
METRIC RANK
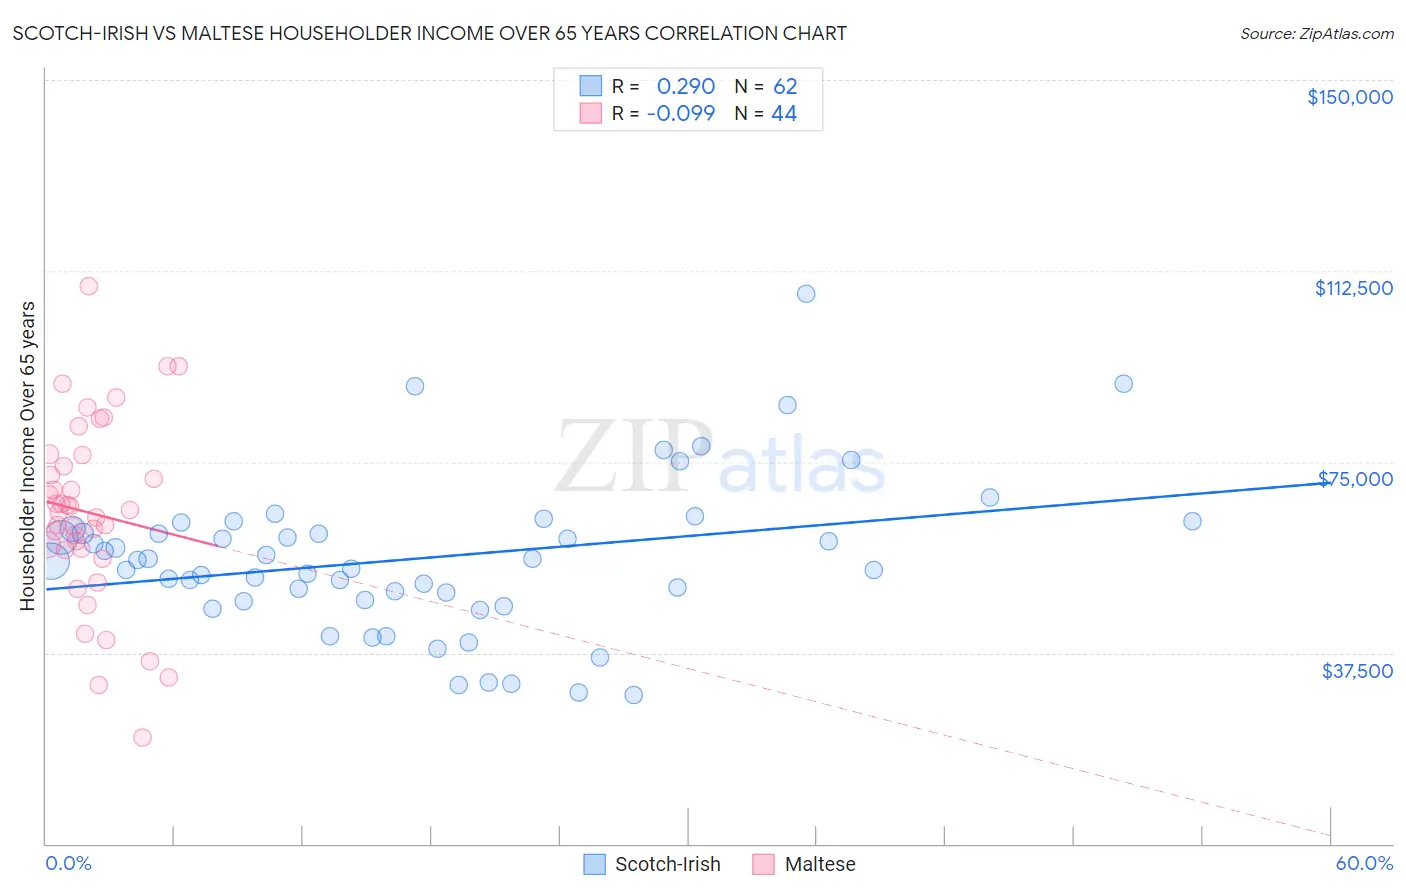
Scotch-Irish vs Maltese Householder Income Over 65 years Correlation Chart
The statistical analysis conducted on geographies consisting of 544,677,827 people shows a weak positive correlation between the proportion of Scotch-Irish and household income with householder over the age of 65 in the United States with a correlation coefficient (R) of 0.290 and weighted average of $59,447. Similarly, the statistical analysis conducted on geographies consisting of 126,350,499 people shows a slight negative correlation between the proportion of Maltese and household income with householder over the age of 65 in the United States with a correlation coefficient (R) of -0.099 and weighted average of $66,027, a difference of 11.1%.
Householder Income Over 65 years Correlation Summary
| Measurement | Scotch-Irish | Maltese |
| Minimum | $29,123 | $20,833 |
| Maximum | $108,125 | $109,444 |
| Range | $79,002 | $88,611 |
| Mean | $56,120 | $65,008 |
| Median | $55,574 | $65,396 |
| Interquartile 25% (IQ1) | $47,845 | $57,781 |
| Interquartile 75% (IQ3) | $61,936 | $75,260 |
| Interquartile Range (IQR) | $14,091 | $17,478 |
| Standard Deviation (Sample) | $15,113 | $18,003 |
| Standard Deviation (Population) | $14,991 | $17,797 |
Similar Demographics by Householder Income Over 65 years
Demographics Similar to Scotch-Irish by Householder Income Over 65 years
In terms of householder income over 65 years, the demographic groups most similar to Scotch-Irish are Arapaho ($59,383, a difference of 0.11%), Dutch ($59,539, a difference of 0.15%), Finnish ($59,535, a difference of 0.15%), Immigrants from Sudan ($59,248, a difference of 0.34%), and Immigrants ($59,656, a difference of 0.35%).
| Demographics | Rating | Rank | Householder Income Over 65 years |
| Germans | 21.5 /100 | #196 | Fair $59,730 |
| Immigrants | Kenya | 21.1 /100 | #197 | Fair $59,710 |
| Moroccans | 20.7 /100 | #198 | Fair $59,683 |
| Immigrants | Immigrants | 20.2 /100 | #199 | Fair $59,656 |
| French | 20.2 /100 | #200 | Fair $59,656 |
| Dutch | 18.3 /100 | #201 | Poor $59,539 |
| Finns | 18.2 /100 | #202 | Poor $59,535 |
| Scotch-Irish | 16.9 /100 | #203 | Poor $59,447 |
| Arapaho | 16.0 /100 | #204 | Poor $59,383 |
| Immigrants | Sudan | 14.2 /100 | #205 | Poor $59,248 |
| Immigrants | South America | 13.0 /100 | #206 | Poor $59,151 |
| Salvadorans | 12.9 /100 | #207 | Poor $59,141 |
| Uruguayans | 12.3 /100 | #208 | Poor $59,090 |
| Slovaks | 11.7 /100 | #209 | Poor $59,039 |
| Nigerians | 11.2 /100 | #210 | Poor $58,992 |
Demographics Similar to Maltese by Householder Income Over 65 years
In terms of householder income over 65 years, the demographic groups most similar to Maltese are Immigrants from Sierra Leone ($66,009, a difference of 0.030%), Immigrants from Lithuania ($66,087, a difference of 0.090%), Immigrants from Norway ($66,118, a difference of 0.14%), Immigrants from Philippines ($66,161, a difference of 0.20%), and Marshallese ($65,874, a difference of 0.23%).
| Demographics | Rating | Rank | Householder Income Over 65 years |
| Immigrants | Netherlands | 99.7 /100 | #54 | Exceptional $66,463 |
| Immigrants | Czechoslovakia | 99.7 /100 | #55 | Exceptional $66,376 |
| Laotians | 99.6 /100 | #56 | Exceptional $66,306 |
| Bulgarians | 99.6 /100 | #57 | Exceptional $66,236 |
| Immigrants | Philippines | 99.6 /100 | #58 | Exceptional $66,161 |
| Immigrants | Norway | 99.5 /100 | #59 | Exceptional $66,118 |
| Immigrants | Lithuania | 99.5 /100 | #60 | Exceptional $66,087 |
| Maltese | 99.5 /100 | #61 | Exceptional $66,027 |
| Immigrants | Sierra Leone | 99.5 /100 | #62 | Exceptional $66,009 |
| Marshallese | 99.4 /100 | #63 | Exceptional $65,874 |
| Zimbabweans | 99.4 /100 | #64 | Exceptional $65,854 |
| Immigrants | England | 99.3 /100 | #65 | Exceptional $65,715 |
| South Africans | 99.3 /100 | #66 | Exceptional $65,652 |
| Immigrants | Malaysia | 99.1 /100 | #67 | Exceptional $65,497 |
| Egyptians | 99.1 /100 | #68 | Exceptional $65,441 |