Sri Lankan vs Afghan Householder Income Over 65 years
COMPARE
Sri Lankan
Afghan
Householder Income Over 65 years
Householder Income Over 65 years Comparison
Sri Lankans
Afghans
$64,201
HOUSEHOLDER INCOME OVER 65 YEARS
96.7/ 100
METRIC RATING
97th/ 347
METRIC RANK
$68,951
HOUSEHOLDER INCOME OVER 65 YEARS
100.0/ 100
METRIC RATING
31st/ 347
METRIC RANK
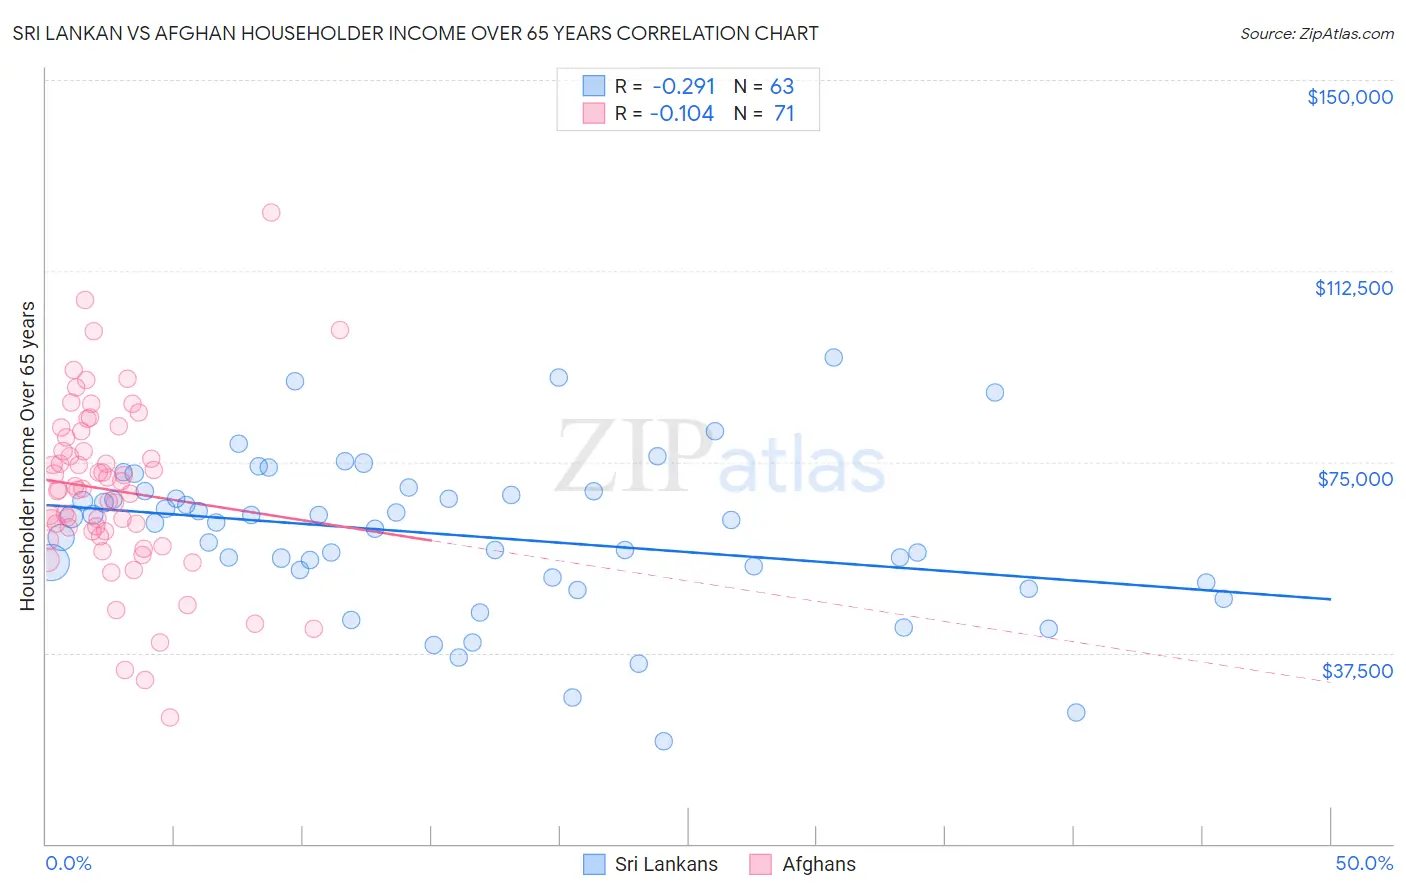
Sri Lankan vs Afghan Householder Income Over 65 years Correlation Chart
The statistical analysis conducted on geographies consisting of 438,467,374 people shows a weak negative correlation between the proportion of Sri Lankans and household income with householder over the age of 65 in the United States with a correlation coefficient (R) of -0.291 and weighted average of $64,201. Similarly, the statistical analysis conducted on geographies consisting of 148,636,797 people shows a poor negative correlation between the proportion of Afghans and household income with householder over the age of 65 in the United States with a correlation coefficient (R) of -0.104 and weighted average of $68,951, a difference of 7.4%.
Householder Income Over 65 years Correlation Summary
| Measurement | Sri Lankan | Afghan |
| Minimum | $20,238 | $24,819 |
| Maximum | $95,504 | $123,958 |
| Range | $75,266 | $99,139 |
| Mean | $60,635 | $69,454 |
| Median | $63,086 | $69,432 |
| Interquartile 25% (IQ1) | $52,337 | $60,485 |
| Interquartile 75% (IQ3) | $69,167 | $79,700 |
| Interquartile Range (IQR) | $16,830 | $19,215 |
| Standard Deviation (Sample) | $15,340 | $17,247 |
| Standard Deviation (Population) | $15,218 | $17,125 |
Similar Demographics by Householder Income Over 65 years
Demographics Similar to Sri Lankans by Householder Income Over 65 years
In terms of householder income over 65 years, the demographic groups most similar to Sri Lankans are Romanian ($64,142, a difference of 0.090%), Immigrants from Hungary ($64,277, a difference of 0.12%), Assyrian/Chaldean/Syriac ($64,108, a difference of 0.14%), Immigrants from Egypt ($64,299, a difference of 0.15%), and Immigrants from Latvia ($64,298, a difference of 0.15%).
| Demographics | Rating | Rank | Householder Income Over 65 years |
| Immigrants | Kuwait | 97.4 /100 | #90 | Exceptional $64,433 |
| Immigrants | Oceania | 97.4 /100 | #91 | Exceptional $64,416 |
| Immigrants | Bulgaria | 97.3 /100 | #92 | Exceptional $64,379 |
| Jordanians | 97.1 /100 | #93 | Exceptional $64,313 |
| Immigrants | Egypt | 97.0 /100 | #94 | Exceptional $64,299 |
| Immigrants | Latvia | 97.0 /100 | #95 | Exceptional $64,298 |
| Immigrants | Hungary | 97.0 /100 | #96 | Exceptional $64,277 |
| Sri Lankans | 96.7 /100 | #97 | Exceptional $64,201 |
| Romanians | 96.5 /100 | #98 | Exceptional $64,142 |
| Assyrians/Chaldeans/Syriacs | 96.4 /100 | #99 | Exceptional $64,108 |
| Immigrants | South Eastern Asia | 96.3 /100 | #100 | Exceptional $64,089 |
| Immigrants | Italy | 96.2 /100 | #101 | Exceptional $64,065 |
| Chileans | 95.8 /100 | #102 | Exceptional $63,957 |
| British | 95.7 /100 | #103 | Exceptional $63,940 |
| Immigrants | Cameroon | 95.6 /100 | #104 | Exceptional $63,907 |
Demographics Similar to Afghans by Householder Income Over 65 years
In terms of householder income over 65 years, the demographic groups most similar to Afghans are Immigrants from Northern Europe ($69,003, a difference of 0.070%), Asian ($68,822, a difference of 0.19%), Immigrants from Denmark ($68,801, a difference of 0.22%), Immigrants from Australia ($69,164, a difference of 0.31%), and Immigrants from China ($69,174, a difference of 0.32%).
| Demographics | Rating | Rank | Householder Income Over 65 years |
| Immigrants | Sweden | 100.0 /100 | #24 | Exceptional $69,722 |
| Immigrants | Belgium | 100.0 /100 | #25 | Exceptional $69,703 |
| Immigrants | Sri Lanka | 100.0 /100 | #26 | Exceptional $69,426 |
| Immigrants | Switzerland | 100.0 /100 | #27 | Exceptional $69,343 |
| Immigrants | China | 100.0 /100 | #28 | Exceptional $69,174 |
| Immigrants | Australia | 100.0 /100 | #29 | Exceptional $69,164 |
| Immigrants | Northern Europe | 100.0 /100 | #30 | Exceptional $69,003 |
| Afghans | 100.0 /100 | #31 | Exceptional $68,951 |
| Asians | 100.0 /100 | #32 | Exceptional $68,822 |
| Immigrants | Denmark | 100.0 /100 | #33 | Exceptional $68,801 |
| Immigrants | Ireland | 100.0 /100 | #34 | Exceptional $68,495 |
| Tongans | 100.0 /100 | #35 | Exceptional $68,235 |
| Immigrants | Austria | 99.9 /100 | #36 | Exceptional $68,208 |
| Turks | 99.9 /100 | #37 | Exceptional $68,037 |
| Estonians | 99.9 /100 | #38 | Exceptional $67,926 |