Scotch-Irish vs Pennsylvania German Householder Income Over 65 years
COMPARE
Scotch-Irish
Pennsylvania German
Householder Income Over 65 years
Householder Income Over 65 years Comparison
Scotch-Irish
Pennsylvania Germans
$59,447
HOUSEHOLDER INCOME OVER 65 YEARS
16.9/ 100
METRIC RATING
203rd/ 347
METRIC RANK
$52,888
HOUSEHOLDER INCOME OVER 65 YEARS
0.0/ 100
METRIC RATING
306th/ 347
METRIC RANK
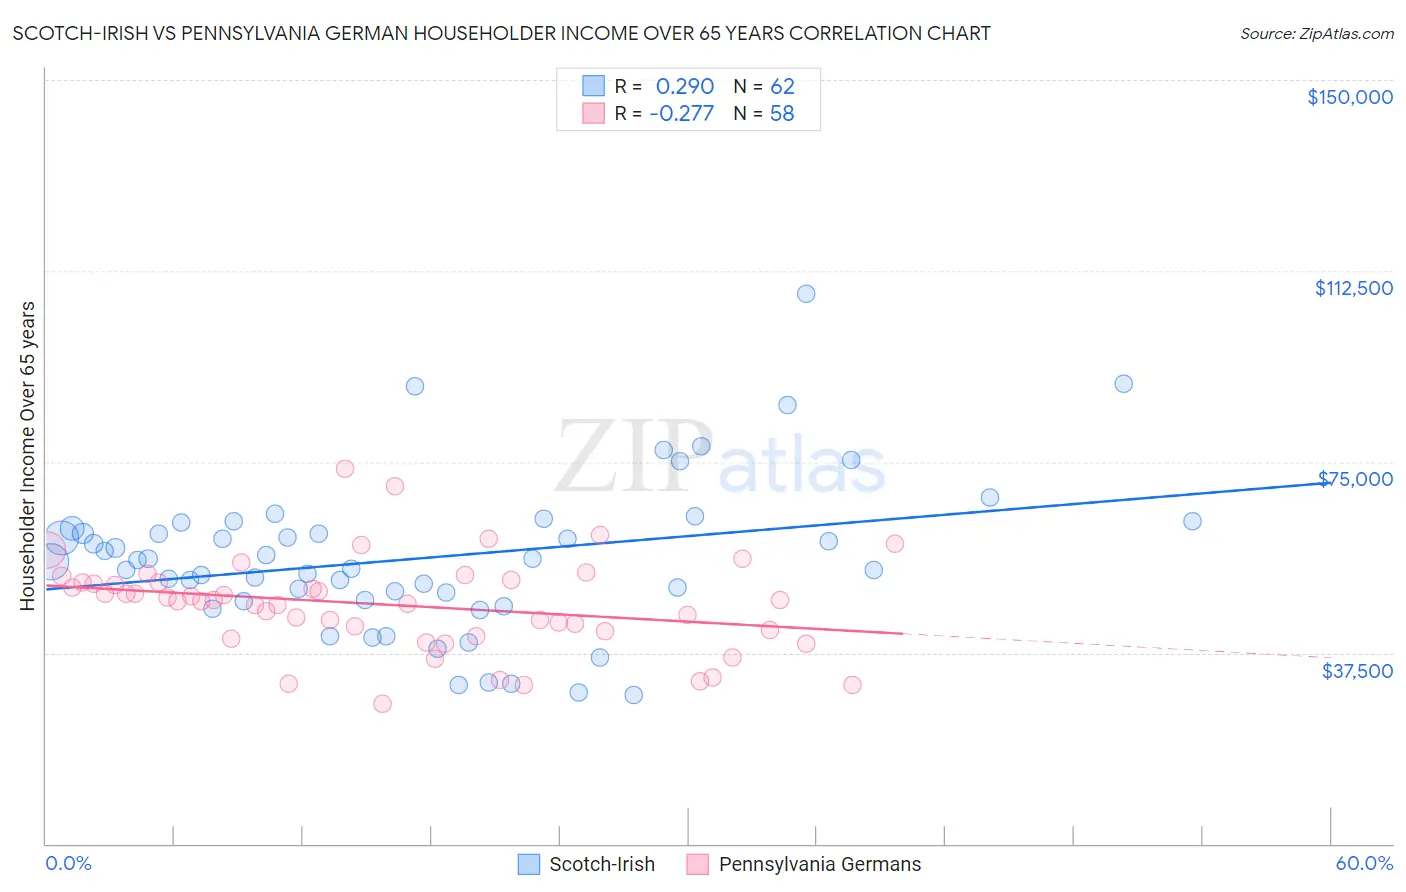
Scotch-Irish vs Pennsylvania German Householder Income Over 65 years Correlation Chart
The statistical analysis conducted on geographies consisting of 544,677,827 people shows a weak positive correlation between the proportion of Scotch-Irish and household income with householder over the age of 65 in the United States with a correlation coefficient (R) of 0.290 and weighted average of $59,447. Similarly, the statistical analysis conducted on geographies consisting of 233,753,814 people shows a weak negative correlation between the proportion of Pennsylvania Germans and household income with householder over the age of 65 in the United States with a correlation coefficient (R) of -0.277 and weighted average of $52,888, a difference of 12.4%.
Householder Income Over 65 years Correlation Summary
| Measurement | Scotch-Irish | Pennsylvania German |
| Minimum | $29,123 | $27,515 |
| Maximum | $108,125 | $73,750 |
| Range | $79,002 | $46,235 |
| Mean | $56,120 | $46,892 |
| Median | $55,574 | $47,645 |
| Interquartile 25% (IQ1) | $47,845 | $41,667 |
| Interquartile 75% (IQ3) | $61,936 | $51,391 |
| Interquartile Range (IQR) | $14,091 | $9,724 |
| Standard Deviation (Sample) | $15,113 | $9,206 |
| Standard Deviation (Population) | $14,991 | $9,127 |
Similar Demographics by Householder Income Over 65 years
Demographics Similar to Scotch-Irish by Householder Income Over 65 years
In terms of householder income over 65 years, the demographic groups most similar to Scotch-Irish are Arapaho ($59,383, a difference of 0.11%), Dutch ($59,539, a difference of 0.15%), Finnish ($59,535, a difference of 0.15%), Immigrants from Sudan ($59,248, a difference of 0.34%), and Immigrants ($59,656, a difference of 0.35%).
| Demographics | Rating | Rank | Householder Income Over 65 years |
| Germans | 21.5 /100 | #196 | Fair $59,730 |
| Immigrants | Kenya | 21.1 /100 | #197 | Fair $59,710 |
| Moroccans | 20.7 /100 | #198 | Fair $59,683 |
| Immigrants | Immigrants | 20.2 /100 | #199 | Fair $59,656 |
| French | 20.2 /100 | #200 | Fair $59,656 |
| Dutch | 18.3 /100 | #201 | Poor $59,539 |
| Finns | 18.2 /100 | #202 | Poor $59,535 |
| Scotch-Irish | 16.9 /100 | #203 | Poor $59,447 |
| Arapaho | 16.0 /100 | #204 | Poor $59,383 |
| Immigrants | Sudan | 14.2 /100 | #205 | Poor $59,248 |
| Immigrants | South America | 13.0 /100 | #206 | Poor $59,151 |
| Salvadorans | 12.9 /100 | #207 | Poor $59,141 |
| Uruguayans | 12.3 /100 | #208 | Poor $59,090 |
| Slovaks | 11.7 /100 | #209 | Poor $59,039 |
| Nigerians | 11.2 /100 | #210 | Poor $58,992 |
Demographics Similar to Pennsylvania Germans by Householder Income Over 65 years
In terms of householder income over 65 years, the demographic groups most similar to Pennsylvania Germans are Pueblo ($52,930, a difference of 0.080%), Ute ($52,949, a difference of 0.11%), Hispanic or Latino ($52,832, a difference of 0.11%), Immigrants from Mexico ($52,801, a difference of 0.17%), and Choctaw ($53,060, a difference of 0.32%).
| Demographics | Rating | Rank | Householder Income Over 65 years |
| Ottawa | 0.0 /100 | #299 | Tragic $53,217 |
| Immigrants | Bahamas | 0.0 /100 | #300 | Tragic $53,174 |
| Yuman | 0.0 /100 | #301 | Tragic $53,110 |
| Spanish American Indians | 0.0 /100 | #302 | Tragic $53,077 |
| Choctaw | 0.0 /100 | #303 | Tragic $53,060 |
| Ute | 0.0 /100 | #304 | Tragic $52,949 |
| Pueblo | 0.0 /100 | #305 | Tragic $52,930 |
| Pennsylvania Germans | 0.0 /100 | #306 | Tragic $52,888 |
| Hispanics or Latinos | 0.0 /100 | #307 | Tragic $52,832 |
| Immigrants | Mexico | 0.0 /100 | #308 | Tragic $52,801 |
| Hondurans | 0.0 /100 | #309 | Tragic $52,634 |
| Sioux | 0.0 /100 | #310 | Tragic $52,509 |
| Seminole | 0.0 /100 | #311 | Tragic $52,373 |
| Immigrants | Azores | 0.0 /100 | #312 | Tragic $52,121 |
| Immigrants | Nicaragua | 0.0 /100 | #313 | Tragic $52,085 |