Scotch-Irish vs Jordanian Householder Income Over 65 years
COMPARE
Scotch-Irish
Jordanian
Householder Income Over 65 years
Householder Income Over 65 years Comparison
Scotch-Irish
Jordanians
$59,447
HOUSEHOLDER INCOME OVER 65 YEARS
16.9/ 100
METRIC RATING
203rd/ 347
METRIC RANK
$64,313
HOUSEHOLDER INCOME OVER 65 YEARS
97.1/ 100
METRIC RATING
93rd/ 347
METRIC RANK
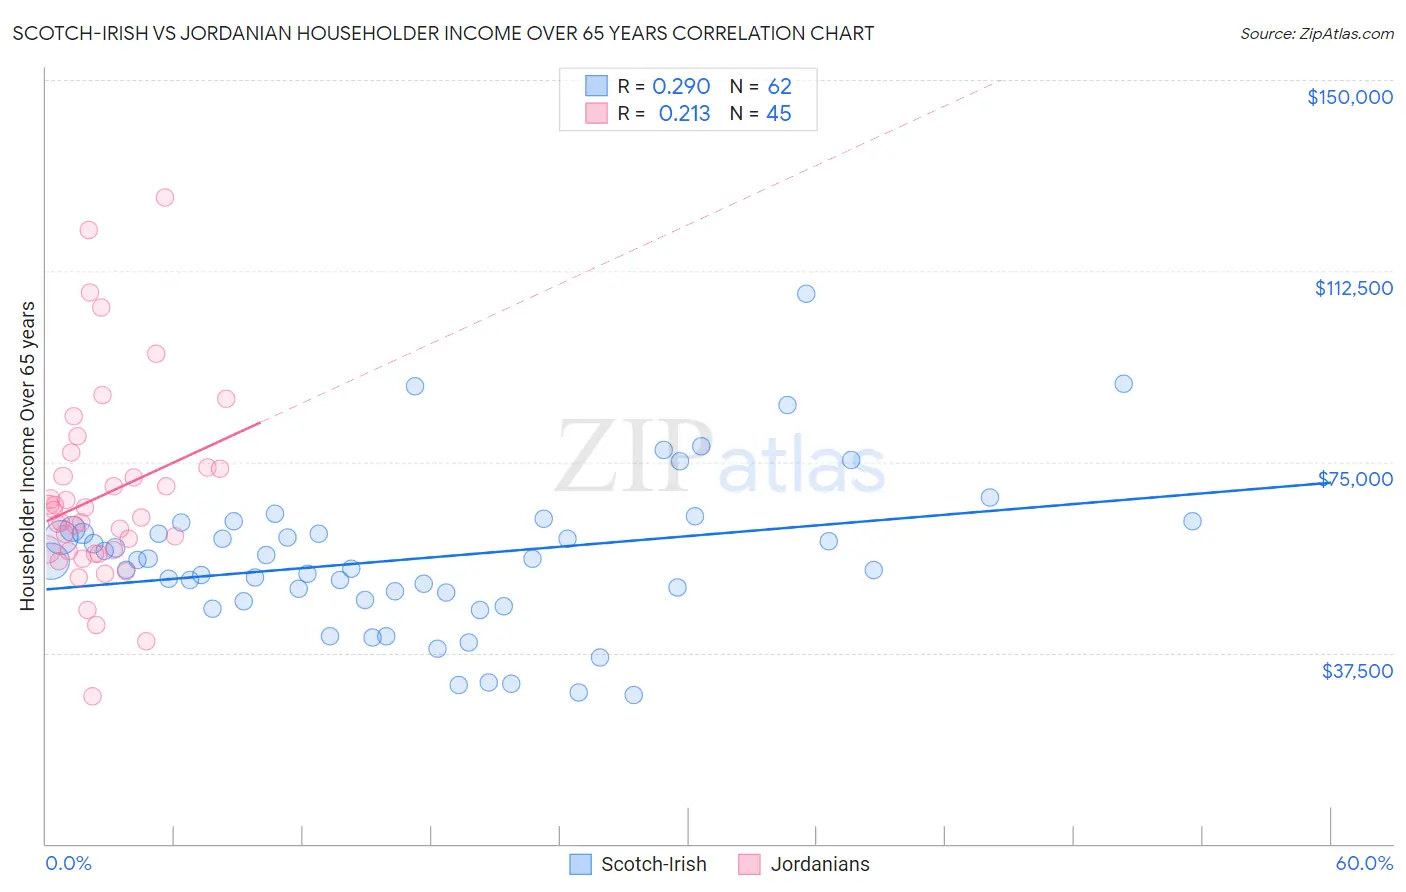
Scotch-Irish vs Jordanian Householder Income Over 65 years Correlation Chart
The statistical analysis conducted on geographies consisting of 544,677,827 people shows a weak positive correlation between the proportion of Scotch-Irish and household income with householder over the age of 65 in the United States with a correlation coefficient (R) of 0.290 and weighted average of $59,447. Similarly, the statistical analysis conducted on geographies consisting of 166,252,116 people shows a weak positive correlation between the proportion of Jordanians and household income with householder over the age of 65 in the United States with a correlation coefficient (R) of 0.213 and weighted average of $64,313, a difference of 8.2%.
Householder Income Over 65 years Correlation Summary
| Measurement | Scotch-Irish | Jordanian |
| Minimum | $29,123 | $29,063 |
| Maximum | $108,125 | $126,912 |
| Range | $79,002 | $97,849 |
| Mean | $56,120 | $68,423 |
| Median | $55,574 | $64,083 |
| Interquartile 25% (IQ1) | $47,845 | $57,185 |
| Interquartile 75% (IQ3) | $61,936 | $73,869 |
| Interquartile Range (IQR) | $14,091 | $16,684 |
| Standard Deviation (Sample) | $15,113 | $19,490 |
| Standard Deviation (Population) | $14,991 | $19,273 |
Similar Demographics by Householder Income Over 65 years
Demographics Similar to Scotch-Irish by Householder Income Over 65 years
In terms of householder income over 65 years, the demographic groups most similar to Scotch-Irish are Arapaho ($59,383, a difference of 0.11%), Dutch ($59,539, a difference of 0.15%), Finnish ($59,535, a difference of 0.15%), Immigrants from Sudan ($59,248, a difference of 0.34%), and Immigrants ($59,656, a difference of 0.35%).
| Demographics | Rating | Rank | Householder Income Over 65 years |
| Germans | 21.5 /100 | #196 | Fair $59,730 |
| Immigrants | Kenya | 21.1 /100 | #197 | Fair $59,710 |
| Moroccans | 20.7 /100 | #198 | Fair $59,683 |
| Immigrants | Immigrants | 20.2 /100 | #199 | Fair $59,656 |
| French | 20.2 /100 | #200 | Fair $59,656 |
| Dutch | 18.3 /100 | #201 | Poor $59,539 |
| Finns | 18.2 /100 | #202 | Poor $59,535 |
| Scotch-Irish | 16.9 /100 | #203 | Poor $59,447 |
| Arapaho | 16.0 /100 | #204 | Poor $59,383 |
| Immigrants | Sudan | 14.2 /100 | #205 | Poor $59,248 |
| Immigrants | South America | 13.0 /100 | #206 | Poor $59,151 |
| Salvadorans | 12.9 /100 | #207 | Poor $59,141 |
| Uruguayans | 12.3 /100 | #208 | Poor $59,090 |
| Slovaks | 11.7 /100 | #209 | Poor $59,039 |
| Nigerians | 11.2 /100 | #210 | Poor $58,992 |
Demographics Similar to Jordanians by Householder Income Over 65 years
In terms of householder income over 65 years, the demographic groups most similar to Jordanians are Immigrants from Egypt ($64,299, a difference of 0.020%), Immigrants from Latvia ($64,298, a difference of 0.020%), Immigrants from Hungary ($64,277, a difference of 0.060%), Immigrants from Bulgaria ($64,379, a difference of 0.10%), and Immigrants from Oceania ($64,416, a difference of 0.16%).
| Demographics | Rating | Rank | Householder Income Over 65 years |
| Immigrants | Russia | 97.6 /100 | #86 | Exceptional $64,512 |
| Austrians | 97.5 /100 | #87 | Exceptional $64,470 |
| Immigrants | Romania | 97.5 /100 | #88 | Exceptional $64,462 |
| Paraguayans | 97.4 /100 | #89 | Exceptional $64,443 |
| Immigrants | Kuwait | 97.4 /100 | #90 | Exceptional $64,433 |
| Immigrants | Oceania | 97.4 /100 | #91 | Exceptional $64,416 |
| Immigrants | Bulgaria | 97.3 /100 | #92 | Exceptional $64,379 |
| Jordanians | 97.1 /100 | #93 | Exceptional $64,313 |
| Immigrants | Egypt | 97.0 /100 | #94 | Exceptional $64,299 |
| Immigrants | Latvia | 97.0 /100 | #95 | Exceptional $64,298 |
| Immigrants | Hungary | 97.0 /100 | #96 | Exceptional $64,277 |
| Sri Lankans | 96.7 /100 | #97 | Exceptional $64,201 |
| Romanians | 96.5 /100 | #98 | Exceptional $64,142 |
| Assyrians/Chaldeans/Syriacs | 96.4 /100 | #99 | Exceptional $64,108 |
| Immigrants | South Eastern Asia | 96.3 /100 | #100 | Exceptional $64,089 |