Scotch-Irish vs Immigrants from Africa Householder Income Over 65 years
COMPARE
Scotch-Irish
Immigrants from Africa
Householder Income Over 65 years
Householder Income Over 65 years Comparison
Scotch-Irish
Immigrants from Africa
$59,447
HOUSEHOLDER INCOME OVER 65 YEARS
16.9/ 100
METRIC RATING
203rd/ 347
METRIC RANK
$59,837
HOUSEHOLDER INCOME OVER 65 YEARS
23.4/ 100
METRIC RATING
194th/ 347
METRIC RANK
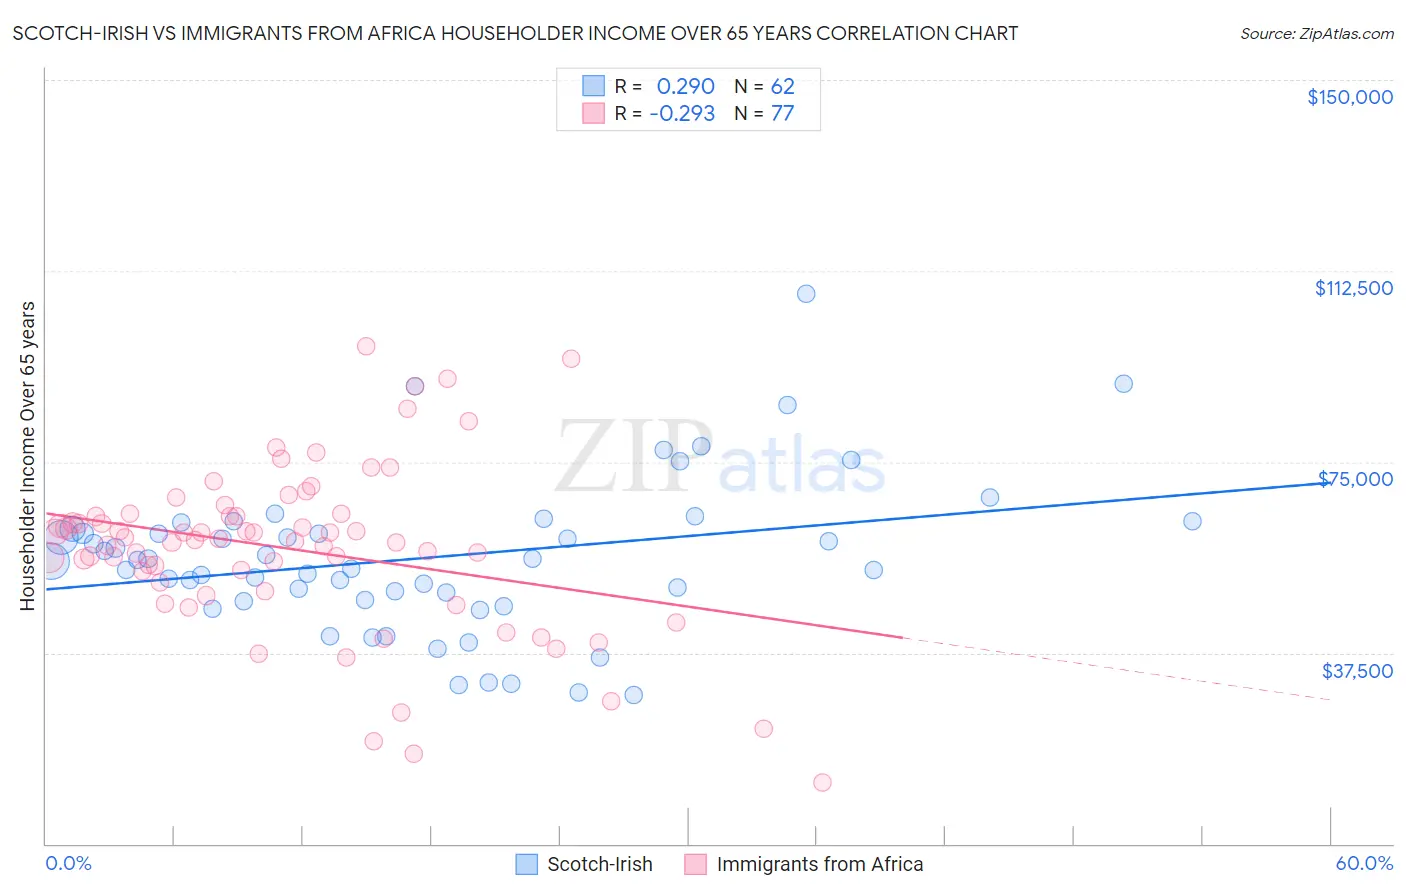
Scotch-Irish vs Immigrants from Africa Householder Income Over 65 years Correlation Chart
The statistical analysis conducted on geographies consisting of 544,677,827 people shows a weak positive correlation between the proportion of Scotch-Irish and household income with householder over the age of 65 in the United States with a correlation coefficient (R) of 0.290 and weighted average of $59,447. Similarly, the statistical analysis conducted on geographies consisting of 467,079,806 people shows a weak negative correlation between the proportion of Immigrants from Africa and household income with householder over the age of 65 in the United States with a correlation coefficient (R) of -0.293 and weighted average of $59,837, a difference of 0.66%.
Householder Income Over 65 years Correlation Summary
| Measurement | Scotch-Irish | Immigrants from Africa |
| Minimum | $29,123 | $12,049 |
| Maximum | $108,125 | $97,634 |
| Range | $79,002 | $85,585 |
| Mean | $56,120 | $57,866 |
| Median | $55,574 | $59,642 |
| Interquartile 25% (IQ1) | $47,845 | $50,510 |
| Interquartile 75% (IQ3) | $61,936 | $64,593 |
| Interquartile Range (IQR) | $14,091 | $14,083 |
| Standard Deviation (Sample) | $15,113 | $16,597 |
| Standard Deviation (Population) | $14,991 | $16,489 |
Demographics Similar to Scotch-Irish and Immigrants from Africa by Householder Income Over 65 years
In terms of householder income over 65 years, the demographic groups most similar to Scotch-Irish are Arapaho ($59,383, a difference of 0.11%), Dutch ($59,539, a difference of 0.15%), Finnish ($59,535, a difference of 0.15%), Immigrants from Sudan ($59,248, a difference of 0.34%), and Immigrants ($59,656, a difference of 0.35%). Similarly, the demographic groups most similar to Immigrants from Africa are Immigrants from Costa Rica ($59,848, a difference of 0.020%), Immigrants from Iraq ($59,824, a difference of 0.020%), South American ($59,854, a difference of 0.030%), Belgian ($59,915, a difference of 0.13%), and Puget Sound Salish ($59,934, a difference of 0.16%).
| Demographics | Rating | Rank | Householder Income Over 65 years |
| Immigrants | Eritrea | 28.6 /100 | #188 | Fair $60,096 |
| Ghanaians | 27.5 /100 | #189 | Fair $60,043 |
| Puget Sound Salish | 25.3 /100 | #190 | Fair $59,934 |
| Belgians | 24.9 /100 | #191 | Fair $59,915 |
| South Americans | 23.8 /100 | #192 | Fair $59,854 |
| Immigrants | Costa Rica | 23.6 /100 | #193 | Fair $59,848 |
| Immigrants | Africa | 23.4 /100 | #194 | Fair $59,837 |
| Immigrants | Iraq | 23.2 /100 | #195 | Fair $59,824 |
| Germans | 21.5 /100 | #196 | Fair $59,730 |
| Immigrants | Kenya | 21.1 /100 | #197 | Fair $59,710 |
| Moroccans | 20.7 /100 | #198 | Fair $59,683 |
| Immigrants | Immigrants | 20.2 /100 | #199 | Fair $59,656 |
| French | 20.2 /100 | #200 | Fair $59,656 |
| Dutch | 18.3 /100 | #201 | Poor $59,539 |
| Finns | 18.2 /100 | #202 | Poor $59,535 |
| Scotch-Irish | 16.9 /100 | #203 | Poor $59,447 |
| Arapaho | 16.0 /100 | #204 | Poor $59,383 |
| Immigrants | Sudan | 14.2 /100 | #205 | Poor $59,248 |
| Immigrants | South America | 13.0 /100 | #206 | Poor $59,151 |
| Salvadorans | 12.9 /100 | #207 | Poor $59,141 |
| Uruguayans | 12.3 /100 | #208 | Poor $59,090 |