Scotch-Irish vs Brazilian Householder Income Over 65 years
COMPARE
Scotch-Irish
Brazilian
Householder Income Over 65 years
Householder Income Over 65 years Comparison
Scotch-Irish
Brazilians
$59,447
HOUSEHOLDER INCOME OVER 65 YEARS
16.9/ 100
METRIC RATING
203rd/ 347
METRIC RANK
$61,465
HOUSEHOLDER INCOME OVER 65 YEARS
62.7/ 100
METRIC RATING
159th/ 347
METRIC RANK
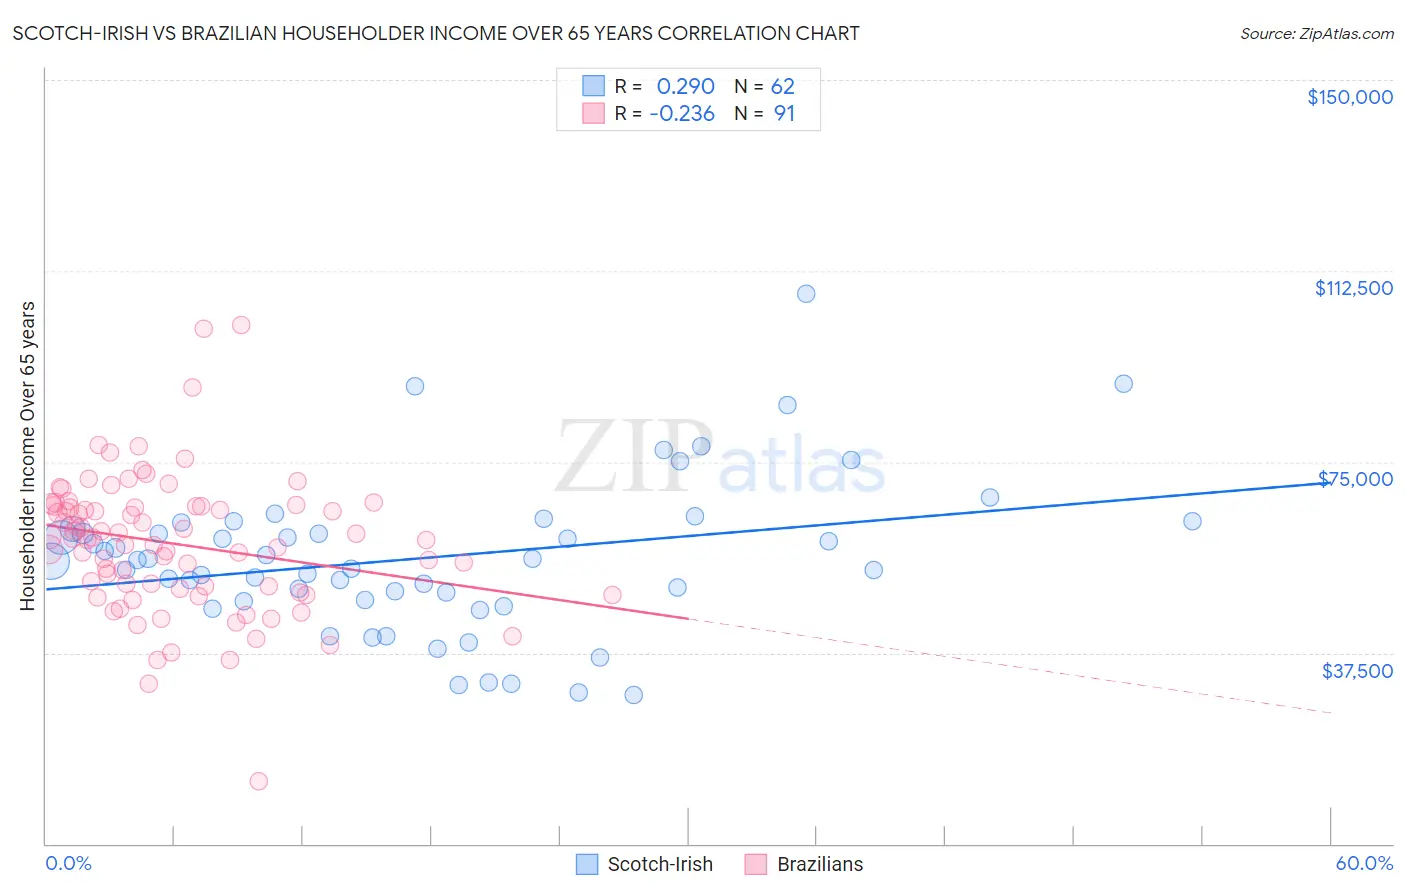
Scotch-Irish vs Brazilian Householder Income Over 65 years Correlation Chart
The statistical analysis conducted on geographies consisting of 544,677,827 people shows a weak positive correlation between the proportion of Scotch-Irish and household income with householder over the age of 65 in the United States with a correlation coefficient (R) of 0.290 and weighted average of $59,447. Similarly, the statistical analysis conducted on geographies consisting of 322,898,345 people shows a weak negative correlation between the proportion of Brazilians and household income with householder over the age of 65 in the United States with a correlation coefficient (R) of -0.236 and weighted average of $61,465, a difference of 3.4%.
Householder Income Over 65 years Correlation Summary
| Measurement | Scotch-Irish | Brazilian |
| Minimum | $29,123 | $12,293 |
| Maximum | $108,125 | $101,779 |
| Range | $79,002 | $89,486 |
| Mean | $56,120 | $58,895 |
| Median | $55,574 | $60,037 |
| Interquartile 25% (IQ1) | $47,845 | $50,127 |
| Interquartile 75% (IQ3) | $61,936 | $66,316 |
| Interquartile Range (IQR) | $14,091 | $16,189 |
| Standard Deviation (Sample) | $15,113 | $13,580 |
| Standard Deviation (Population) | $14,991 | $13,505 |
Similar Demographics by Householder Income Over 65 years
Demographics Similar to Scotch-Irish by Householder Income Over 65 years
In terms of householder income over 65 years, the demographic groups most similar to Scotch-Irish are Arapaho ($59,383, a difference of 0.11%), Dutch ($59,539, a difference of 0.15%), Finnish ($59,535, a difference of 0.15%), Immigrants from Sudan ($59,248, a difference of 0.34%), and Immigrants ($59,656, a difference of 0.35%).
| Demographics | Rating | Rank | Householder Income Over 65 years |
| Germans | 21.5 /100 | #196 | Fair $59,730 |
| Immigrants | Kenya | 21.1 /100 | #197 | Fair $59,710 |
| Moroccans | 20.7 /100 | #198 | Fair $59,683 |
| Immigrants | Immigrants | 20.2 /100 | #199 | Fair $59,656 |
| French | 20.2 /100 | #200 | Fair $59,656 |
| Dutch | 18.3 /100 | #201 | Poor $59,539 |
| Finns | 18.2 /100 | #202 | Poor $59,535 |
| Scotch-Irish | 16.9 /100 | #203 | Poor $59,447 |
| Arapaho | 16.0 /100 | #204 | Poor $59,383 |
| Immigrants | Sudan | 14.2 /100 | #205 | Poor $59,248 |
| Immigrants | South America | 13.0 /100 | #206 | Poor $59,151 |
| Salvadorans | 12.9 /100 | #207 | Poor $59,141 |
| Uruguayans | 12.3 /100 | #208 | Poor $59,090 |
| Slovaks | 11.7 /100 | #209 | Poor $59,039 |
| Nigerians | 11.2 /100 | #210 | Poor $58,992 |
Demographics Similar to Brazilians by Householder Income Over 65 years
In terms of householder income over 65 years, the demographic groups most similar to Brazilians are English ($61,487, a difference of 0.040%), Portuguese ($61,440, a difference of 0.040%), Macedonian ($61,564, a difference of 0.16%), Scandinavian ($61,586, a difference of 0.20%), and Polish ($61,598, a difference of 0.22%).
| Demographics | Rating | Rank | Householder Income Over 65 years |
| Armenians | 67.3 /100 | #152 | Good $61,656 |
| Costa Ricans | 66.9 /100 | #153 | Good $61,638 |
| Swiss | 66.5 /100 | #154 | Good $61,621 |
| Poles | 65.9 /100 | #155 | Good $61,598 |
| Scandinavians | 65.6 /100 | #156 | Good $61,586 |
| Macedonians | 65.1 /100 | #157 | Good $61,564 |
| English | 63.3 /100 | #158 | Good $61,487 |
| Brazilians | 62.7 /100 | #159 | Good $61,465 |
| Portuguese | 62.1 /100 | #160 | Good $61,440 |
| Icelanders | 57.9 /100 | #161 | Average $61,270 |
| Czechs | 57.2 /100 | #162 | Average $61,244 |
| Ugandans | 55.5 /100 | #163 | Average $61,177 |
| Immigrants | North Macedonia | 55.4 /100 | #164 | Average $61,175 |
| Immigrants | Ukraine | 55.1 /100 | #165 | Average $61,163 |
| Immigrants | Eastern Africa | 55.0 /100 | #166 | Average $61,157 |