Scotch-Irish vs Afghan In Labor Force | Age 25-29
COMPARE
Scotch-Irish
Afghan
In Labor Force | Age 25-29
In Labor Force | Age 25-29 Comparison
Scotch-Irish
Afghans
84.2%
IN LABOR FORCE | AGE 25-29
6.5/ 100
METRIC RATING
223rd/ 347
METRIC RANK
84.4%
IN LABOR FORCE | AGE 25-29
15.9/ 100
METRIC RATING
202nd/ 347
METRIC RANK
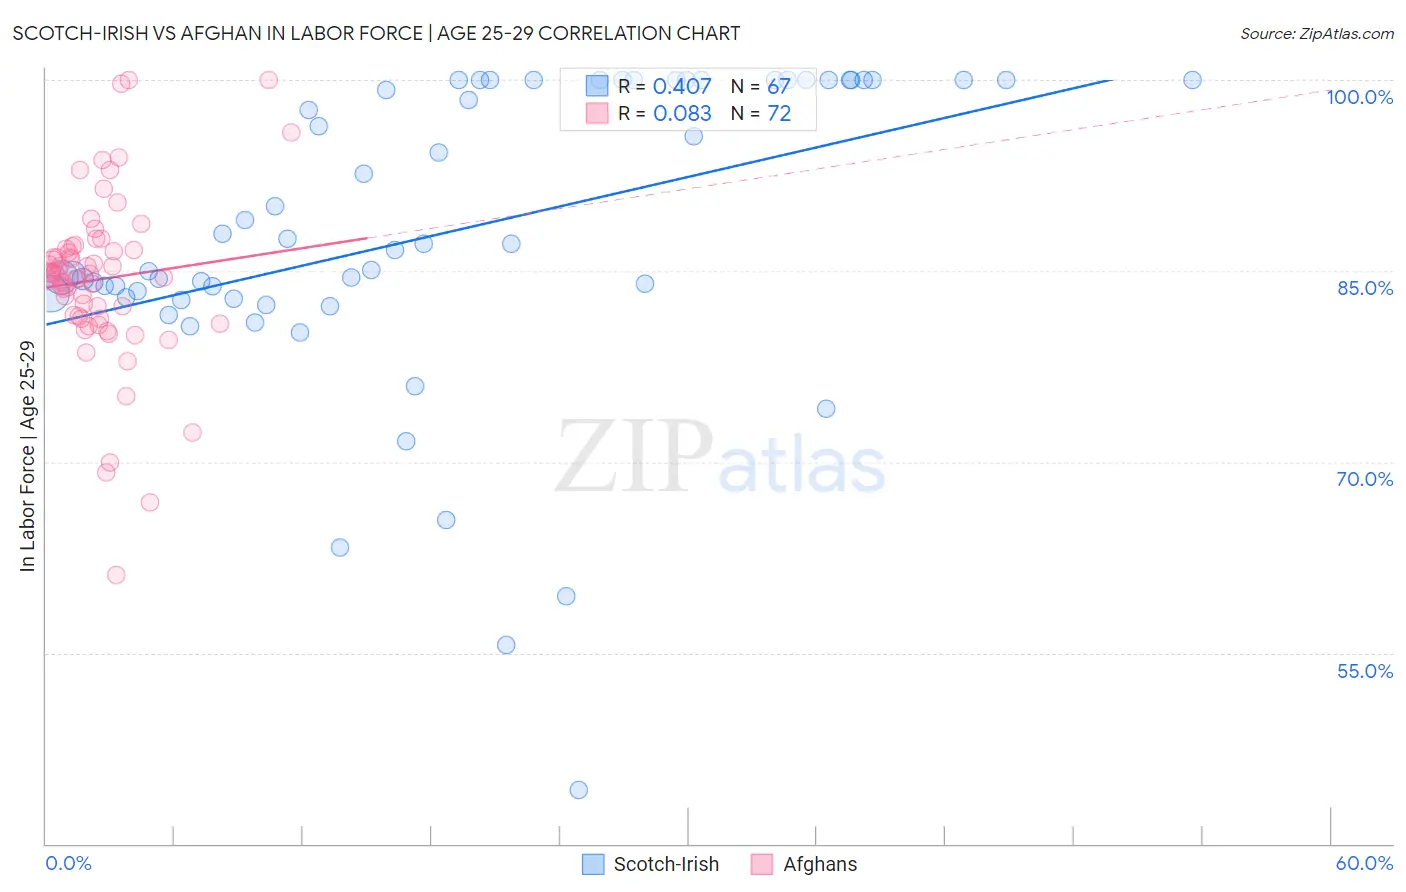
Scotch-Irish vs Afghan In Labor Force | Age 25-29 Correlation Chart
The statistical analysis conducted on geographies consisting of 547,797,884 people shows a moderate positive correlation between the proportion of Scotch-Irish and labor force participation rate among population between the ages 25 and 29 in the United States with a correlation coefficient (R) of 0.407 and weighted average of 84.2%. Similarly, the statistical analysis conducted on geographies consisting of 148,868,617 people shows a slight positive correlation between the proportion of Afghans and labor force participation rate among population between the ages 25 and 29 in the United States with a correlation coefficient (R) of 0.083 and weighted average of 84.4%, a difference of 0.19%.
In Labor Force | Age 25-29 Correlation Summary
| Measurement | Scotch-Irish | Afghan |
| Minimum | 44.2% | 61.1% |
| Maximum | 100.0% | 100.0% |
| Range | 55.8% | 38.9% |
| Mean | 88.0% | 84.3% |
| Median | 87.1% | 84.7% |
| Interquartile 25% (IQ1) | 82.9% | 81.3% |
| Interquartile 75% (IQ3) | 100.0% | 86.7% |
| Interquartile Range (IQR) | 17.1% | 5.4% |
| Standard Deviation (Sample) | 12.1% | 6.7% |
| Standard Deviation (Population) | 12.0% | 6.6% |
Similar Demographics by In Labor Force | Age 25-29
Demographics Similar to Scotch-Irish by In Labor Force | Age 25-29
In terms of in labor force | age 25-29, the demographic groups most similar to Scotch-Irish are Arab (84.2%, a difference of 0.010%), Jordanian (84.2%, a difference of 0.010%), Immigrants from West Indies (84.2%, a difference of 0.010%), Nigerian (84.3%, a difference of 0.020%), and Korean (84.2%, a difference of 0.020%).
| Demographics | Rating | Rank | In Labor Force | Age 25-29 |
| Israelis | 9.3 /100 | #216 | Tragic 84.3% |
| Immigrants | Ecuador | 9.3 /100 | #217 | Tragic 84.3% |
| Immigrants | Nigeria | 9.0 /100 | #218 | Tragic 84.3% |
| Immigrants | Saudi Arabia | 8.8 /100 | #219 | Tragic 84.3% |
| Nigerians | 7.2 /100 | #220 | Tragic 84.3% |
| Arabs | 6.8 /100 | #221 | Tragic 84.2% |
| Jordanians | 6.7 /100 | #222 | Tragic 84.2% |
| Scotch-Irish | 6.5 /100 | #223 | Tragic 84.2% |
| Immigrants | West Indies | 6.0 /100 | #224 | Tragic 84.2% |
| Koreans | 5.9 /100 | #225 | Tragic 84.2% |
| Immigrants | Congo | 5.8 /100 | #226 | Tragic 84.2% |
| French American Indians | 5.5 /100 | #227 | Tragic 84.2% |
| Immigrants | Panama | 5.5 /100 | #228 | Tragic 84.2% |
| Immigrants | Oceania | 5.0 /100 | #229 | Tragic 84.2% |
| Whites/Caucasians | 4.8 /100 | #230 | Tragic 84.2% |
Demographics Similar to Afghans by In Labor Force | Age 25-29
In terms of in labor force | age 25-29, the demographic groups most similar to Afghans are Immigrants from Afghanistan (84.4%, a difference of 0.0%), Laotian (84.4%, a difference of 0.010%), Venezuelan (84.4%, a difference of 0.010%), Immigrants from Kazakhstan (84.4%, a difference of 0.020%), and Ecuadorian (84.4%, a difference of 0.020%).
| Demographics | Rating | Rank | In Labor Force | Age 25-29 |
| Immigrants | Israel | 20.8 /100 | #195 | Fair 84.4% |
| Immigrants | South Eastern Asia | 19.5 /100 | #196 | Poor 84.4% |
| Tlingit-Haida | 19.3 /100 | #197 | Poor 84.4% |
| Immigrants | Iraq | 19.0 /100 | #198 | Poor 84.4% |
| Immigrants | Germany | 18.3 /100 | #199 | Poor 84.4% |
| Immigrants | Kazakhstan | 17.5 /100 | #200 | Poor 84.4% |
| Laotians | 16.6 /100 | #201 | Poor 84.4% |
| Afghans | 15.9 /100 | #202 | Poor 84.4% |
| Immigrants | Afghanistan | 15.6 /100 | #203 | Poor 84.4% |
| Venezuelans | 15.1 /100 | #204 | Poor 84.4% |
| Ecuadorians | 14.8 /100 | #205 | Poor 84.4% |
| Immigrants | Cambodia | 14.3 /100 | #206 | Poor 84.4% |
| Immigrants | Armenia | 13.3 /100 | #207 | Poor 84.4% |
| Immigrants | Indonesia | 13.2 /100 | #208 | Poor 84.4% |
| Immigrants | Jordan | 12.8 /100 | #209 | Poor 84.4% |