Scotch-Irish vs Basque Householder Income Over 65 years
COMPARE
Scotch-Irish
Basque
Householder Income Over 65 years
Householder Income Over 65 years Comparison
Scotch-Irish
Basques
$59,447
HOUSEHOLDER INCOME OVER 65 YEARS
16.9/ 100
METRIC RATING
203rd/ 347
METRIC RANK
$62,653
HOUSEHOLDER INCOME OVER 65 YEARS
85.4/ 100
METRIC RATING
130th/ 347
METRIC RANK
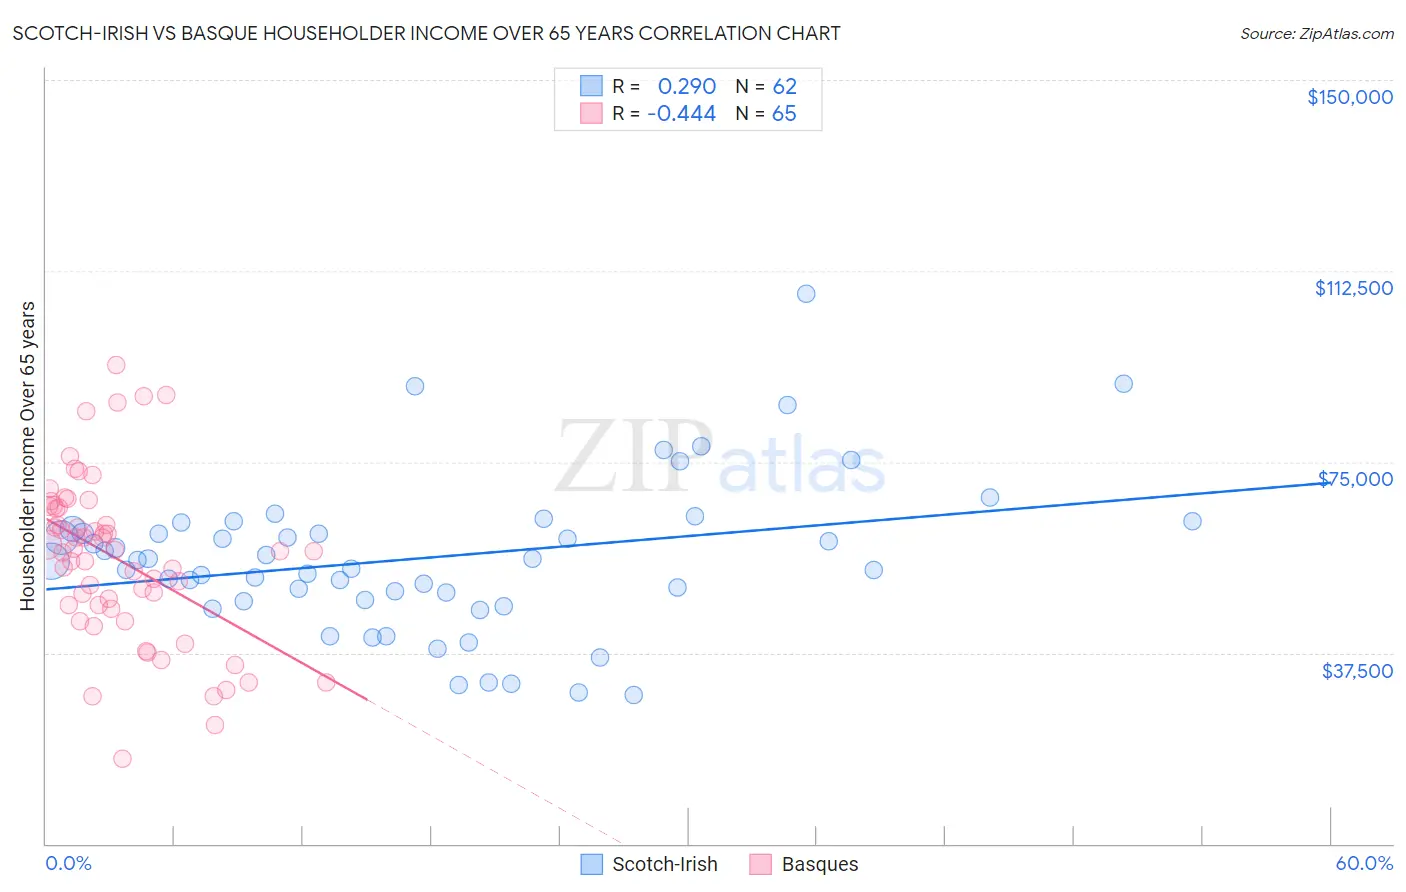
Scotch-Irish vs Basque Householder Income Over 65 years Correlation Chart
The statistical analysis conducted on geographies consisting of 544,677,827 people shows a weak positive correlation between the proportion of Scotch-Irish and household income with householder over the age of 65 in the United States with a correlation coefficient (R) of 0.290 and weighted average of $59,447. Similarly, the statistical analysis conducted on geographies consisting of 165,583,325 people shows a moderate negative correlation between the proportion of Basques and household income with householder over the age of 65 in the United States with a correlation coefficient (R) of -0.444 and weighted average of $62,653, a difference of 5.4%.
Householder Income Over 65 years Correlation Summary
| Measurement | Scotch-Irish | Basque |
| Minimum | $29,123 | $16,667 |
| Maximum | $108,125 | $94,125 |
| Range | $79,002 | $77,458 |
| Mean | $56,120 | $55,918 |
| Median | $55,574 | $57,500 |
| Interquartile 25% (IQ1) | $47,845 | $46,469 |
| Interquartile 75% (IQ3) | $61,936 | $66,222 |
| Interquartile Range (IQR) | $14,091 | $19,753 |
| Standard Deviation (Sample) | $15,113 | $16,196 |
| Standard Deviation (Population) | $14,991 | $16,071 |
Similar Demographics by Householder Income Over 65 years
Demographics Similar to Scotch-Irish by Householder Income Over 65 years
In terms of householder income over 65 years, the demographic groups most similar to Scotch-Irish are Arapaho ($59,383, a difference of 0.11%), Dutch ($59,539, a difference of 0.15%), Finnish ($59,535, a difference of 0.15%), Immigrants from Sudan ($59,248, a difference of 0.34%), and Immigrants ($59,656, a difference of 0.35%).
| Demographics | Rating | Rank | Householder Income Over 65 years |
| Germans | 21.5 /100 | #196 | Fair $59,730 |
| Immigrants | Kenya | 21.1 /100 | #197 | Fair $59,710 |
| Moroccans | 20.7 /100 | #198 | Fair $59,683 |
| Immigrants | Immigrants | 20.2 /100 | #199 | Fair $59,656 |
| French | 20.2 /100 | #200 | Fair $59,656 |
| Dutch | 18.3 /100 | #201 | Poor $59,539 |
| Finns | 18.2 /100 | #202 | Poor $59,535 |
| Scotch-Irish | 16.9 /100 | #203 | Poor $59,447 |
| Arapaho | 16.0 /100 | #204 | Poor $59,383 |
| Immigrants | Sudan | 14.2 /100 | #205 | Poor $59,248 |
| Immigrants | South America | 13.0 /100 | #206 | Poor $59,151 |
| Salvadorans | 12.9 /100 | #207 | Poor $59,141 |
| Uruguayans | 12.3 /100 | #208 | Poor $59,090 |
| Slovaks | 11.7 /100 | #209 | Poor $59,039 |
| Nigerians | 11.2 /100 | #210 | Poor $58,992 |
Demographics Similar to Basques by Householder Income Over 65 years
In terms of householder income over 65 years, the demographic groups most similar to Basques are Immigrants from Western Asia ($62,645, a difference of 0.010%), Immigrants from Eastern Europe ($62,693, a difference of 0.060%), Aleut ($62,708, a difference of 0.090%), Swedish ($62,736, a difference of 0.13%), and Immigrants from Germany ($62,544, a difference of 0.17%).
| Demographics | Rating | Rank | Householder Income Over 65 years |
| Tlingit-Haida | 88.6 /100 | #123 | Excellent $62,922 |
| Taiwanese | 88.3 /100 | #124 | Excellent $62,894 |
| Soviet Union | 87.8 /100 | #125 | Excellent $62,848 |
| Peruvians | 86.8 /100 | #126 | Excellent $62,766 |
| Swedes | 86.4 /100 | #127 | Excellent $62,736 |
| Aleuts | 86.1 /100 | #128 | Excellent $62,708 |
| Immigrants | Eastern Europe | 85.9 /100 | #129 | Excellent $62,693 |
| Basques | 85.4 /100 | #130 | Excellent $62,653 |
| Immigrants | Western Asia | 85.3 /100 | #131 | Excellent $62,645 |
| Immigrants | Germany | 83.9 /100 | #132 | Excellent $62,544 |
| Immigrants | Northern Africa | 83.6 /100 | #133 | Excellent $62,522 |
| Immigrants | Brazil | 81.2 /100 | #134 | Excellent $62,364 |
| Immigrants | Chile | 81.0 /100 | #135 | Excellent $62,354 |
| Alaskan Athabascans | 80.6 /100 | #136 | Excellent $62,330 |
| Immigrants | Syria | 80.2 /100 | #137 | Excellent $62,303 |