Cambodian vs Afghan Householder Income Over 65 years
COMPARE
Cambodian
Afghan
Householder Income Over 65 years
Householder Income Over 65 years Comparison
Cambodians
Afghans
$66,892
HOUSEHOLDER INCOME OVER 65 YEARS
99.8/ 100
METRIC RATING
46th/ 347
METRIC RANK
$68,951
HOUSEHOLDER INCOME OVER 65 YEARS
100.0/ 100
METRIC RATING
31st/ 347
METRIC RANK
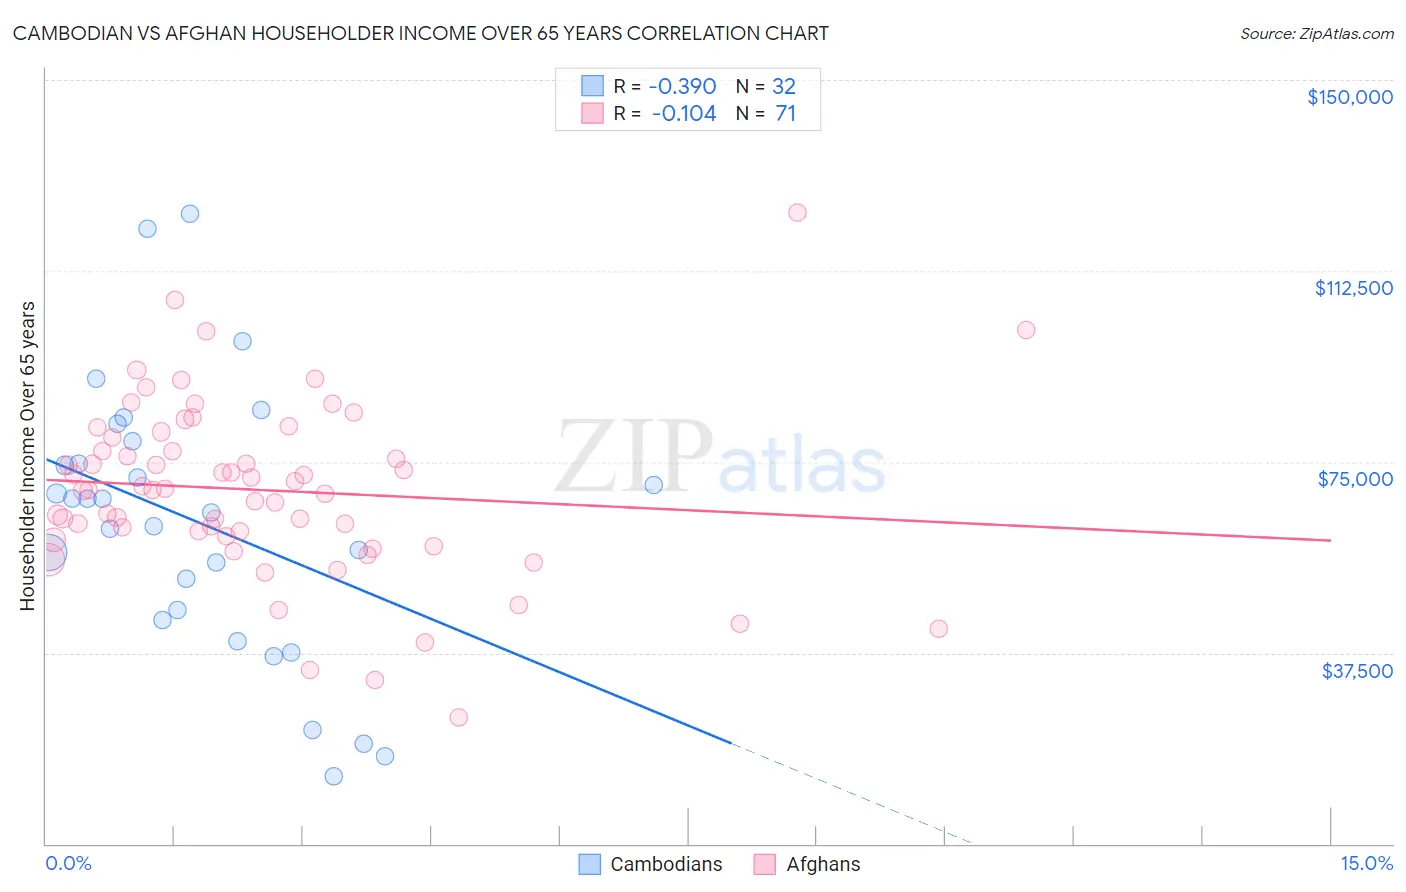
Cambodian vs Afghan Householder Income Over 65 years Correlation Chart
The statistical analysis conducted on geographies consisting of 102,372,212 people shows a mild negative correlation between the proportion of Cambodians and household income with householder over the age of 65 in the United States with a correlation coefficient (R) of -0.390 and weighted average of $66,892. Similarly, the statistical analysis conducted on geographies consisting of 148,636,797 people shows a poor negative correlation between the proportion of Afghans and household income with householder over the age of 65 in the United States with a correlation coefficient (R) of -0.104 and weighted average of $68,951, a difference of 3.1%.
Householder Income Over 65 years Correlation Summary
| Measurement | Cambodian | Afghan |
| Minimum | $13,250 | $24,819 |
| Maximum | $123,750 | $123,958 |
| Range | $110,500 | $99,139 |
| Mean | $63,009 | $69,454 |
| Median | $66,420 | $69,432 |
| Interquartile 25% (IQ1) | $44,945 | $60,485 |
| Interquartile 75% (IQ3) | $76,799 | $79,700 |
| Interquartile Range (IQR) | $31,853 | $19,215 |
| Standard Deviation (Sample) | $26,681 | $17,247 |
| Standard Deviation (Population) | $26,261 | $17,125 |
Demographics Similar to Cambodians and Afghans by Householder Income Over 65 years
In terms of householder income over 65 years, the demographic groups most similar to Cambodians are Australian ($66,891, a difference of 0.0%), Immigrants from France ($66,826, a difference of 0.10%), Immigrants from Afghanistan ($67,007, a difference of 0.17%), Immigrants from South Africa ($67,234, a difference of 0.51%), and Latvian ($67,326, a difference of 0.65%). Similarly, the demographic groups most similar to Afghans are Immigrants from Northern Europe ($69,003, a difference of 0.070%), Asian ($68,822, a difference of 0.19%), Immigrants from Denmark ($68,801, a difference of 0.22%), Immigrants from Australia ($69,164, a difference of 0.31%), and Immigrants from China ($69,174, a difference of 0.32%).
| Demographics | Rating | Rank | Householder Income Over 65 years |
| Immigrants | China | 100.0 /100 | #28 | Exceptional $69,174 |
| Immigrants | Australia | 100.0 /100 | #29 | Exceptional $69,164 |
| Immigrants | Northern Europe | 100.0 /100 | #30 | Exceptional $69,003 |
| Afghans | 100.0 /100 | #31 | Exceptional $68,951 |
| Asians | 100.0 /100 | #32 | Exceptional $68,822 |
| Immigrants | Denmark | 100.0 /100 | #33 | Exceptional $68,801 |
| Immigrants | Ireland | 100.0 /100 | #34 | Exceptional $68,495 |
| Tongans | 100.0 /100 | #35 | Exceptional $68,235 |
| Immigrants | Austria | 99.9 /100 | #36 | Exceptional $68,208 |
| Turks | 99.9 /100 | #37 | Exceptional $68,037 |
| Estonians | 99.9 /100 | #38 | Exceptional $67,926 |
| Russians | 99.9 /100 | #39 | Exceptional $67,626 |
| Immigrants | Asia | 99.9 /100 | #40 | Exceptional $67,594 |
| Koreans | 99.9 /100 | #41 | Exceptional $67,472 |
| New Zealanders | 99.9 /100 | #42 | Exceptional $67,333 |
| Latvians | 99.9 /100 | #43 | Exceptional $67,326 |
| Immigrants | South Africa | 99.9 /100 | #44 | Exceptional $67,234 |
| Immigrants | Afghanistan | 99.8 /100 | #45 | Exceptional $67,007 |
| Cambodians | 99.8 /100 | #46 | Exceptional $66,892 |
| Australians | 99.8 /100 | #47 | Exceptional $66,891 |
| Immigrants | France | 99.8 /100 | #48 | Exceptional $66,826 |