Scotch-Irish vs Bangladeshi Householder Income Over 65 years
COMPARE
Scotch-Irish
Bangladeshi
Householder Income Over 65 years
Householder Income Over 65 years Comparison
Scotch-Irish
Bangladeshis
$59,447
HOUSEHOLDER INCOME OVER 65 YEARS
16.9/ 100
METRIC RATING
203rd/ 347
METRIC RANK
$54,719
HOUSEHOLDER INCOME OVER 65 YEARS
0.1/ 100
METRIC RATING
262nd/ 347
METRIC RANK
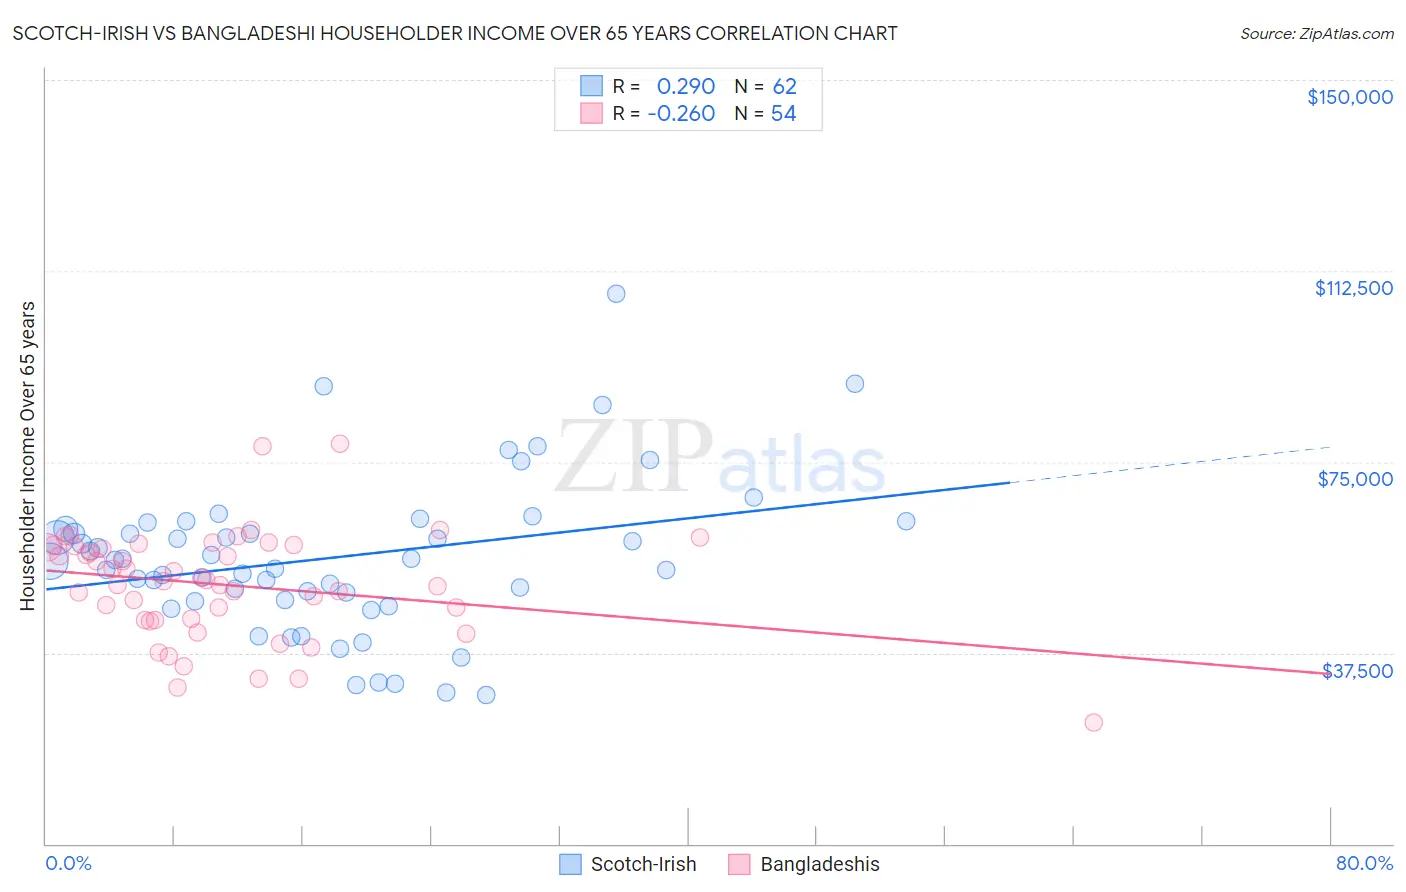
Scotch-Irish vs Bangladeshi Householder Income Over 65 years Correlation Chart
The statistical analysis conducted on geographies consisting of 544,677,827 people shows a weak positive correlation between the proportion of Scotch-Irish and household income with householder over the age of 65 in the United States with a correlation coefficient (R) of 0.290 and weighted average of $59,447. Similarly, the statistical analysis conducted on geographies consisting of 140,913,932 people shows a weak negative correlation between the proportion of Bangladeshis and household income with householder over the age of 65 in the United States with a correlation coefficient (R) of -0.260 and weighted average of $54,719, a difference of 8.6%.
Householder Income Over 65 years Correlation Summary
| Measurement | Scotch-Irish | Bangladeshi |
| Minimum | $29,123 | $23,750 |
| Maximum | $108,125 | $78,500 |
| Range | $79,002 | $54,750 |
| Mean | $56,120 | $50,859 |
| Median | $55,574 | $51,575 |
| Interquartile 25% (IQ1) | $47,845 | $43,904 |
| Interquartile 75% (IQ3) | $61,936 | $58,421 |
| Interquartile Range (IQR) | $14,091 | $14,517 |
| Standard Deviation (Sample) | $15,113 | $10,619 |
| Standard Deviation (Population) | $14,991 | $10,520 |
Similar Demographics by Householder Income Over 65 years
Demographics Similar to Scotch-Irish by Householder Income Over 65 years
In terms of householder income over 65 years, the demographic groups most similar to Scotch-Irish are Arapaho ($59,383, a difference of 0.11%), Dutch ($59,539, a difference of 0.15%), Finnish ($59,535, a difference of 0.15%), Immigrants from Sudan ($59,248, a difference of 0.34%), and Immigrants ($59,656, a difference of 0.35%).
| Demographics | Rating | Rank | Householder Income Over 65 years |
| Germans | 21.5 /100 | #196 | Fair $59,730 |
| Immigrants | Kenya | 21.1 /100 | #197 | Fair $59,710 |
| Moroccans | 20.7 /100 | #198 | Fair $59,683 |
| Immigrants | Immigrants | 20.2 /100 | #199 | Fair $59,656 |
| French | 20.2 /100 | #200 | Fair $59,656 |
| Dutch | 18.3 /100 | #201 | Poor $59,539 |
| Finns | 18.2 /100 | #202 | Poor $59,535 |
| Scotch-Irish | 16.9 /100 | #203 | Poor $59,447 |
| Arapaho | 16.0 /100 | #204 | Poor $59,383 |
| Immigrants | Sudan | 14.2 /100 | #205 | Poor $59,248 |
| Immigrants | South America | 13.0 /100 | #206 | Poor $59,151 |
| Salvadorans | 12.9 /100 | #207 | Poor $59,141 |
| Uruguayans | 12.3 /100 | #208 | Poor $59,090 |
| Slovaks | 11.7 /100 | #209 | Poor $59,039 |
| Nigerians | 11.2 /100 | #210 | Poor $58,992 |
Demographics Similar to Bangladeshis by Householder Income Over 65 years
In terms of householder income over 65 years, the demographic groups most similar to Bangladeshis are French American Indian ($54,699, a difference of 0.040%), Apache ($54,668, a difference of 0.090%), Belizean ($54,580, a difference of 0.25%), Jamaican ($54,560, a difference of 0.29%), and Guatemalan ($54,526, a difference of 0.35%).
| Demographics | Rating | Rank | Householder Income Over 65 years |
| Immigrants | Bangladesh | 0.3 /100 | #255 | Tragic $55,394 |
| German Russians | 0.3 /100 | #256 | Tragic $55,356 |
| Trinidadians and Tobagonians | 0.3 /100 | #257 | Tragic $55,327 |
| Ecuadorians | 0.2 /100 | #258 | Tragic $54,958 |
| West Indians | 0.2 /100 | #259 | Tragic $54,936 |
| Immigrants | West Indies | 0.2 /100 | #260 | Tragic $54,927 |
| Comanche | 0.2 /100 | #261 | Tragic $54,922 |
| Bangladeshis | 0.1 /100 | #262 | Tragic $54,719 |
| French American Indians | 0.1 /100 | #263 | Tragic $54,699 |
| Apache | 0.1 /100 | #264 | Tragic $54,668 |
| Belizeans | 0.1 /100 | #265 | Tragic $54,580 |
| Jamaicans | 0.1 /100 | #266 | Tragic $54,560 |
| Guatemalans | 0.1 /100 | #267 | Tragic $54,526 |
| Immigrants | Zaire | 0.1 /100 | #268 | Tragic $54,512 |
| Nicaraguans | 0.1 /100 | #269 | Tragic $54,474 |