Peruvian vs Immigrants from Sudan Wage/Income Gap
COMPARE
Peruvian
Immigrants from Sudan
Wage/Income Gap
Wage/Income Gap Comparison
Peruvians
Immigrants from Sudan
25.6%
WAGE/INCOME GAP
60.1/ 100
METRIC RATING
169th/ 347
METRIC RANK
23.6%
WAGE/INCOME GAP
99.4/ 100
METRIC RATING
97th/ 347
METRIC RANK
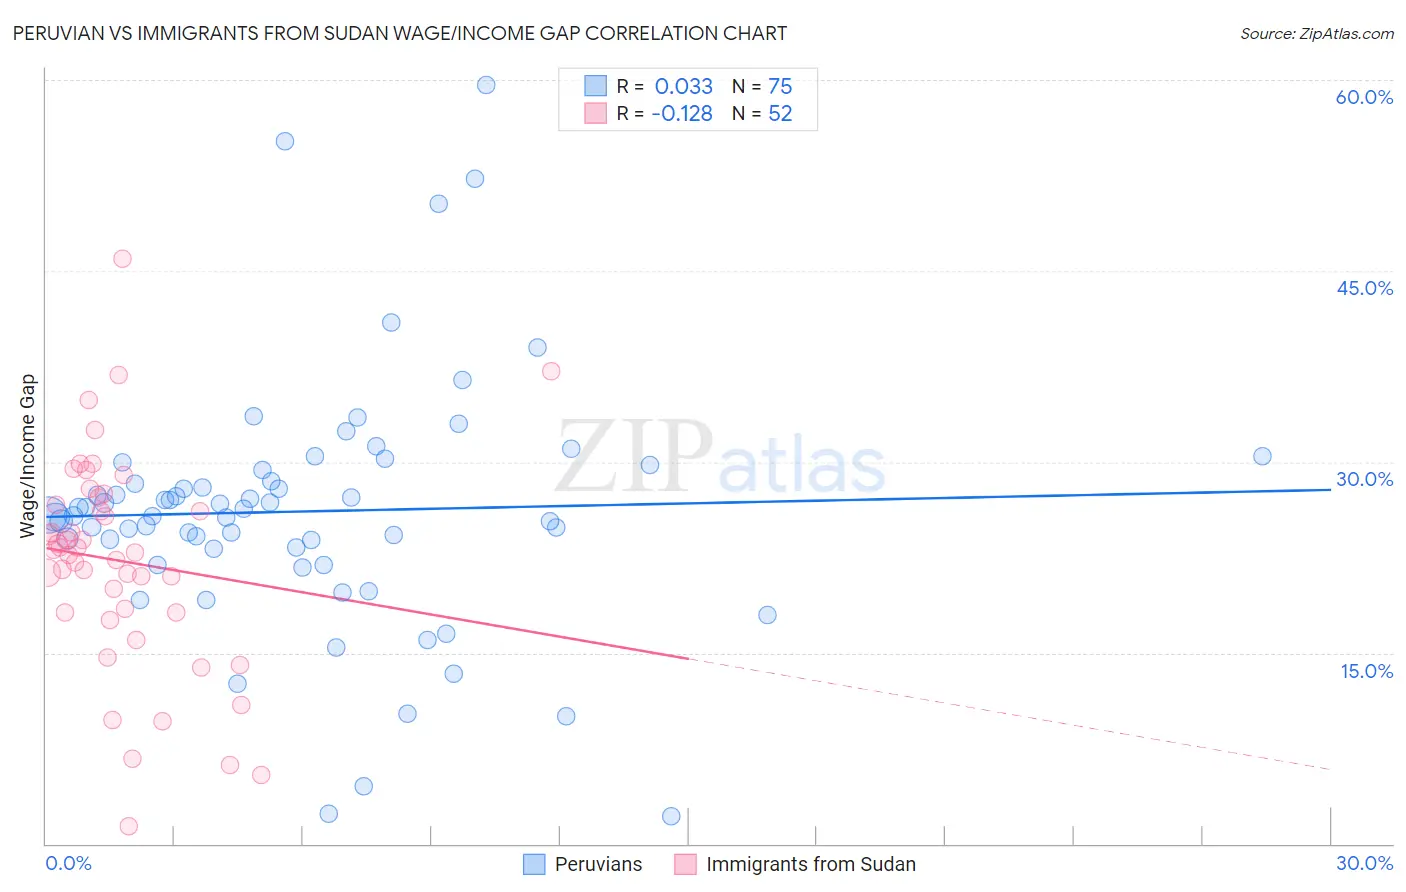
Peruvian vs Immigrants from Sudan Wage/Income Gap Correlation Chart
The statistical analysis conducted on geographies consisting of 363,114,915 people shows no correlation between the proportion of Peruvians and wage/income gap percentage in the United States with a correlation coefficient (R) of 0.033 and weighted average of 25.6%. Similarly, the statistical analysis conducted on geographies consisting of 118,934,661 people shows a poor negative correlation between the proportion of Immigrants from Sudan and wage/income gap percentage in the United States with a correlation coefficient (R) of -0.128 and weighted average of 23.6%, a difference of 8.3%.
Wage/Income Gap Correlation Summary
| Measurement | Peruvian | Immigrants from Sudan |
| Minimum | 2.2% | 1.4% |
| Maximum | 59.6% | 46.0% |
| Range | 57.4% | 44.6% |
| Mean | 26.1% | 22.2% |
| Median | 25.9% | 23.0% |
| Interquartile 25% (IQ1) | 23.1% | 18.1% |
| Interquartile 75% (IQ3) | 29.3% | 26.9% |
| Interquartile Range (IQR) | 6.2% | 8.8% |
| Standard Deviation (Sample) | 9.9% | 8.5% |
| Standard Deviation (Population) | 9.8% | 8.4% |
Similar Demographics by Wage/Income Gap
Demographics Similar to Peruvians by Wage/Income Gap
In terms of wage/income gap, the demographic groups most similar to Peruvians are Immigrants from Oceania (25.6%, a difference of 0.17%), Seminole (25.6%, a difference of 0.18%), Paiute (25.5%, a difference of 0.20%), Immigrants from Greece (25.7%, a difference of 0.23%), and Immigrants from Ukraine (25.5%, a difference of 0.26%).
| Demographics | Rating | Rank | Wage/Income Gap |
| Shoshone | 69.0 /100 | #162 | Good 25.4% |
| Native Hawaiians | 69.0 /100 | #163 | Good 25.4% |
| Koreans | 68.6 /100 | #164 | Good 25.4% |
| Immigrants | Hong Kong | 64.0 /100 | #165 | Good 25.5% |
| Immigrants | Ukraine | 63.8 /100 | #166 | Good 25.5% |
| Paiute | 62.9 /100 | #167 | Good 25.5% |
| Seminole | 62.6 /100 | #168 | Good 25.6% |
| Peruvians | 60.1 /100 | #169 | Good 25.6% |
| Immigrants | Oceania | 57.5 /100 | #170 | Average 25.6% |
| Immigrants | Greece | 56.6 /100 | #171 | Average 25.7% |
| Immigrants | Chile | 53.2 /100 | #172 | Average 25.7% |
| Immigrants | Belarus | 52.9 /100 | #173 | Average 25.7% |
| Alaskan Athabascans | 50.0 /100 | #174 | Average 25.8% |
| Sri Lankans | 47.0 /100 | #175 | Average 25.8% |
| Paraguayans | 46.7 /100 | #176 | Average 25.8% |
Demographics Similar to Immigrants from Sudan by Wage/Income Gap
In terms of wage/income gap, the demographic groups most similar to Immigrants from Sudan are Kiowa (23.6%, a difference of 0.090%), Cape Verdean (23.6%, a difference of 0.21%), Honduran (23.6%, a difference of 0.24%), Immigrants from Cabo Verde (23.6%, a difference of 0.33%), and Immigrants from Latin America (23.7%, a difference of 0.40%).
| Demographics | Rating | Rank | Wage/Income Gap |
| Nicaraguans | 99.6 /100 | #90 | Exceptional 23.4% |
| Arapaho | 99.6 /100 | #91 | Exceptional 23.5% |
| Immigrants | Honduras | 99.5 /100 | #92 | Exceptional 23.5% |
| Immigrants | Cabo Verde | 99.5 /100 | #93 | Exceptional 23.6% |
| Hondurans | 99.5 /100 | #94 | Exceptional 23.6% |
| Cape Verdeans | 99.4 /100 | #95 | Exceptional 23.6% |
| Kiowa | 99.4 /100 | #96 | Exceptional 23.6% |
| Immigrants | Sudan | 99.4 /100 | #97 | Exceptional 23.6% |
| Immigrants | Latin America | 99.2 /100 | #98 | Exceptional 23.7% |
| Aleuts | 99.2 /100 | #99 | Exceptional 23.7% |
| Yakama | 99.2 /100 | #100 | Exceptional 23.7% |
| Japanese | 99.1 /100 | #101 | Exceptional 23.8% |
| Immigrants | Laos | 99.0 /100 | #102 | Exceptional 23.8% |
| Tsimshian | 98.9 /100 | #103 | Exceptional 23.9% |
| Tlingit-Haida | 98.7 /100 | #104 | Exceptional 24.0% |