Immigrants from Spain vs Immigrants from Sudan Wage/Income Gap
COMPARE
Immigrants from Spain
Immigrants from Sudan
Wage/Income Gap
Wage/Income Gap Comparison
Immigrants from Spain
Immigrants from Sudan
26.8%
WAGE/INCOME GAP
8.5/ 100
METRIC RATING
221st/ 347
METRIC RANK
23.6%
WAGE/INCOME GAP
99.4/ 100
METRIC RATING
97th/ 347
METRIC RANK
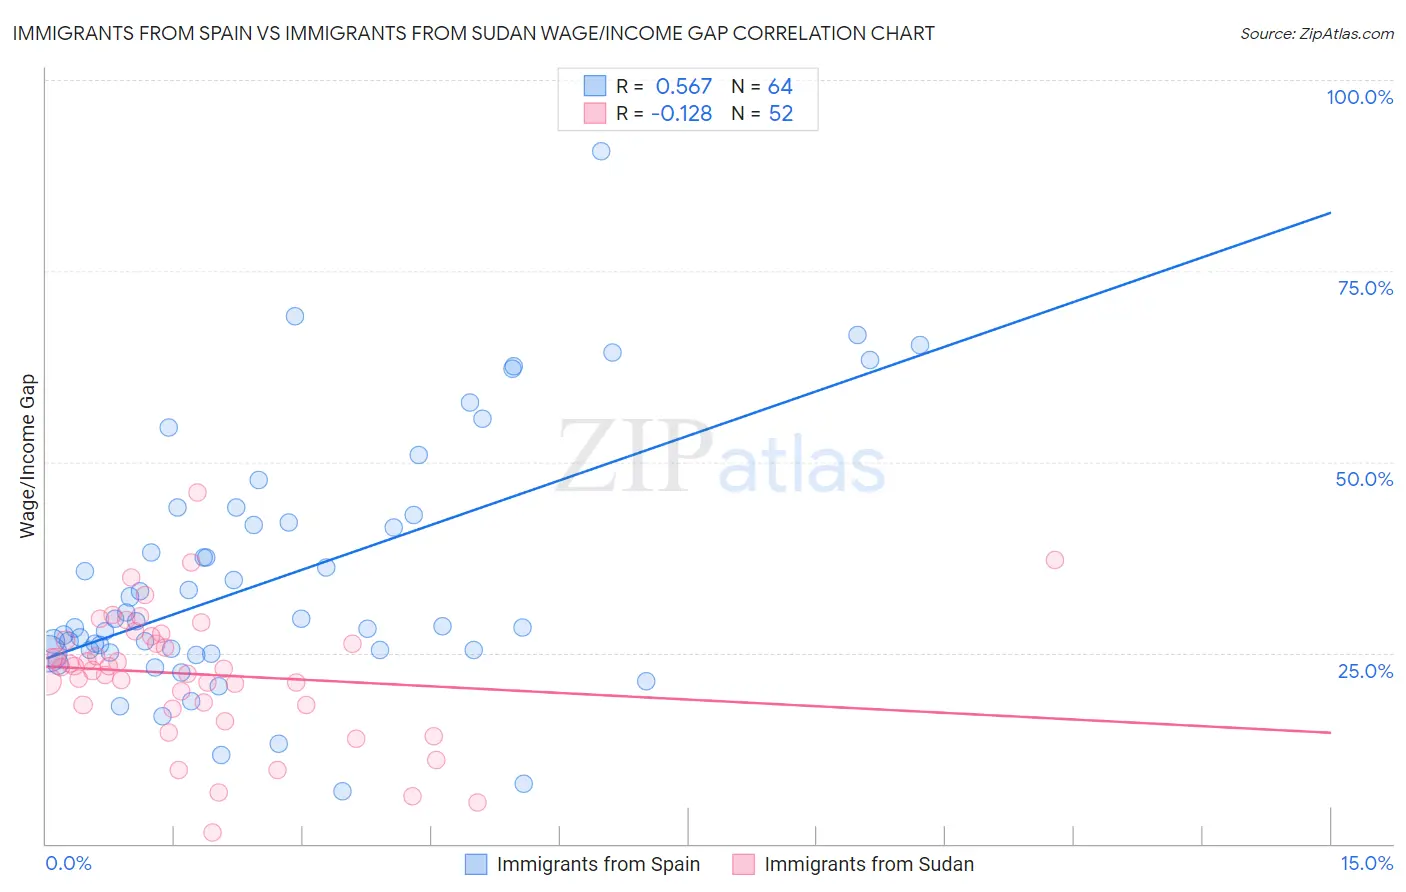
Immigrants from Spain vs Immigrants from Sudan Wage/Income Gap Correlation Chart
The statistical analysis conducted on geographies consisting of 239,614,609 people shows a substantial positive correlation between the proportion of Immigrants from Spain and wage/income gap percentage in the United States with a correlation coefficient (R) of 0.567 and weighted average of 26.8%. Similarly, the statistical analysis conducted on geographies consisting of 118,934,661 people shows a poor negative correlation between the proportion of Immigrants from Sudan and wage/income gap percentage in the United States with a correlation coefficient (R) of -0.128 and weighted average of 23.6%, a difference of 13.3%.
Wage/Income Gap Correlation Summary
| Measurement | Immigrants from Spain | Immigrants from Sudan |
| Minimum | 6.9% | 1.4% |
| Maximum | 90.7% | 46.0% |
| Range | 83.8% | 44.6% |
| Mean | 34.9% | 22.2% |
| Median | 28.8% | 23.0% |
| Interquartile 25% (IQ1) | 25.2% | 18.1% |
| Interquartile 75% (IQ3) | 42.5% | 26.9% |
| Interquartile Range (IQR) | 17.4% | 8.8% |
| Standard Deviation (Sample) | 16.6% | 8.5% |
| Standard Deviation (Population) | 16.5% | 8.4% |
Similar Demographics by Wage/Income Gap
Demographics Similar to Immigrants from Spain by Wage/Income Gap
In terms of wage/income gap, the demographic groups most similar to Immigrants from Spain are Bolivian (26.8%, a difference of 0.040%), Immigrants from Latvia (26.7%, a difference of 0.070%), Immigrants from Poland (26.7%, a difference of 0.080%), Immigrants from Saudi Arabia (26.7%, a difference of 0.11%), and Jordanian (26.8%, a difference of 0.11%).
| Demographics | Rating | Rank | Wage/Income Gap |
| Immigrants | China | 10.3 /100 | #214 | Poor 26.7% |
| Yugoslavians | 9.7 /100 | #215 | Tragic 26.7% |
| Immigrants | Portugal | 9.5 /100 | #216 | Tragic 26.7% |
| Brazilians | 9.2 /100 | #217 | Tragic 26.7% |
| Immigrants | Saudi Arabia | 9.1 /100 | #218 | Tragic 26.7% |
| Immigrants | Poland | 8.9 /100 | #219 | Tragic 26.7% |
| Immigrants | Latvia | 8.9 /100 | #220 | Tragic 26.7% |
| Immigrants | Spain | 8.5 /100 | #221 | Tragic 26.8% |
| Bolivians | 8.3 /100 | #222 | Tragic 26.8% |
| Jordanians | 8.0 /100 | #223 | Tragic 26.8% |
| Immigrants | Argentina | 7.2 /100 | #224 | Tragic 26.8% |
| Immigrants | Ireland | 6.5 /100 | #225 | Tragic 26.9% |
| Asians | 5.9 /100 | #226 | Tragic 26.9% |
| Spaniards | 5.6 /100 | #227 | Tragic 27.0% |
| Immigrants | Turkey | 5.6 /100 | #228 | Tragic 27.0% |
Demographics Similar to Immigrants from Sudan by Wage/Income Gap
In terms of wage/income gap, the demographic groups most similar to Immigrants from Sudan are Kiowa (23.6%, a difference of 0.090%), Cape Verdean (23.6%, a difference of 0.21%), Honduran (23.6%, a difference of 0.24%), Immigrants from Cabo Verde (23.6%, a difference of 0.33%), and Immigrants from Latin America (23.7%, a difference of 0.40%).
| Demographics | Rating | Rank | Wage/Income Gap |
| Nicaraguans | 99.6 /100 | #90 | Exceptional 23.4% |
| Arapaho | 99.6 /100 | #91 | Exceptional 23.5% |
| Immigrants | Honduras | 99.5 /100 | #92 | Exceptional 23.5% |
| Immigrants | Cabo Verde | 99.5 /100 | #93 | Exceptional 23.6% |
| Hondurans | 99.5 /100 | #94 | Exceptional 23.6% |
| Cape Verdeans | 99.4 /100 | #95 | Exceptional 23.6% |
| Kiowa | 99.4 /100 | #96 | Exceptional 23.6% |
| Immigrants | Sudan | 99.4 /100 | #97 | Exceptional 23.6% |
| Immigrants | Latin America | 99.2 /100 | #98 | Exceptional 23.7% |
| Aleuts | 99.2 /100 | #99 | Exceptional 23.7% |
| Yakama | 99.2 /100 | #100 | Exceptional 23.7% |
| Japanese | 99.1 /100 | #101 | Exceptional 23.8% |
| Immigrants | Laos | 99.0 /100 | #102 | Exceptional 23.8% |
| Tsimshian | 98.9 /100 | #103 | Exceptional 23.9% |
| Tlingit-Haida | 98.7 /100 | #104 | Exceptional 24.0% |