Scotch-Irish vs Immigrants from Sudan Wage/Income Gap
COMPARE
Scotch-Irish
Immigrants from Sudan
Wage/Income Gap
Wage/Income Gap Comparison
Scotch-Irish
Immigrants from Sudan
28.5%
WAGE/INCOME GAP
0.2/ 100
METRIC RATING
302nd/ 347
METRIC RANK
23.6%
WAGE/INCOME GAP
99.4/ 100
METRIC RATING
97th/ 347
METRIC RANK
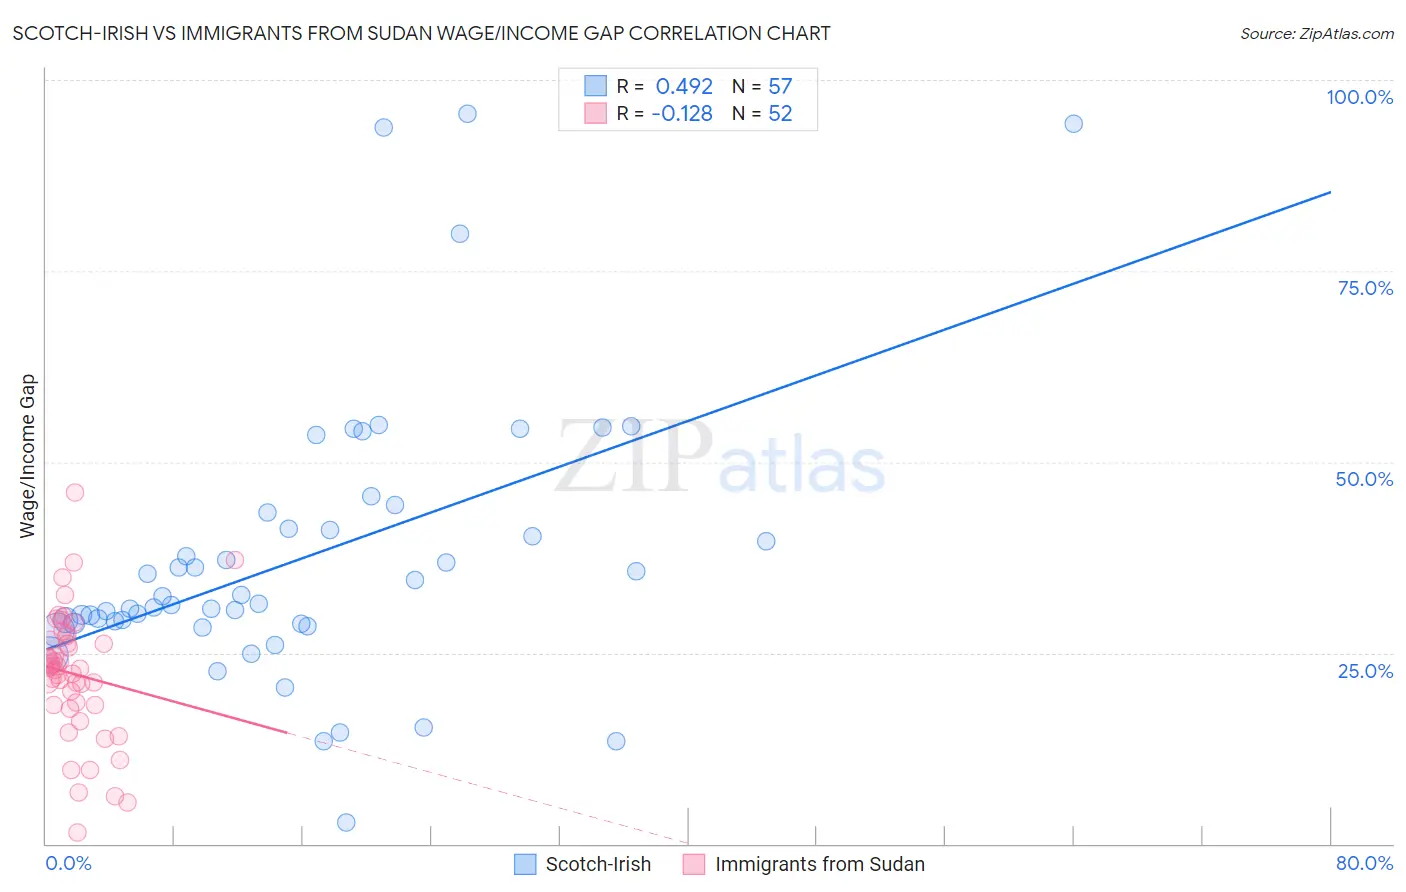
Scotch-Irish vs Immigrants from Sudan Wage/Income Gap Correlation Chart
The statistical analysis conducted on geographies consisting of 546,535,842 people shows a moderate positive correlation between the proportion of Scotch-Irish and wage/income gap percentage in the United States with a correlation coefficient (R) of 0.492 and weighted average of 28.5%. Similarly, the statistical analysis conducted on geographies consisting of 118,934,661 people shows a poor negative correlation between the proportion of Immigrants from Sudan and wage/income gap percentage in the United States with a correlation coefficient (R) of -0.128 and weighted average of 23.6%, a difference of 20.5%.
Wage/Income Gap Correlation Summary
| Measurement | Scotch-Irish | Immigrants from Sudan |
| Minimum | 2.8% | 1.4% |
| Maximum | 95.6% | 46.0% |
| Range | 92.8% | 44.6% |
| Mean | 37.5% | 22.2% |
| Median | 31.4% | 23.0% |
| Interquartile 25% (IQ1) | 28.8% | 18.1% |
| Interquartile 75% (IQ3) | 42.3% | 26.9% |
| Interquartile Range (IQR) | 13.5% | 8.8% |
| Standard Deviation (Sample) | 18.6% | 8.5% |
| Standard Deviation (Population) | 18.4% | 8.4% |
Similar Demographics by Wage/Income Gap
Demographics Similar to Scotch-Irish by Wage/Income Gap
In terms of wage/income gap, the demographic groups most similar to Scotch-Irish are Irish (28.5%, a difference of 0.0%), Immigrants from Canada (28.5%, a difference of 0.030%), Immigrants from Northern Europe (28.5%, a difference of 0.070%), Immigrants from Netherlands (28.5%, a difference of 0.080%), and Immigrants from South Africa (28.5%, a difference of 0.10%).
| Demographics | Rating | Rank | Wage/Income Gap |
| Slovenes | 0.3 /100 | #295 | Tragic 28.3% |
| Northern Europeans | 0.3 /100 | #296 | Tragic 28.3% |
| Immigrants | North America | 0.2 /100 | #297 | Tragic 28.4% |
| Austrians | 0.2 /100 | #298 | Tragic 28.4% |
| Immigrants | North Macedonia | 0.2 /100 | #299 | Tragic 28.4% |
| Immigrants | Northern Europe | 0.2 /100 | #300 | Tragic 28.5% |
| Immigrants | Canada | 0.2 /100 | #301 | Tragic 28.5% |
| Scotch-Irish | 0.2 /100 | #302 | Tragic 28.5% |
| Irish | 0.2 /100 | #303 | Tragic 28.5% |
| Immigrants | Netherlands | 0.2 /100 | #304 | Tragic 28.5% |
| Immigrants | South Africa | 0.1 /100 | #305 | Tragic 28.5% |
| Whites/Caucasians | 0.1 /100 | #306 | Tragic 28.5% |
| Immigrants | Denmark | 0.1 /100 | #307 | Tragic 28.5% |
| Poles | 0.1 /100 | #308 | Tragic 28.5% |
| Macedonians | 0.1 /100 | #309 | Tragic 28.6% |
Demographics Similar to Immigrants from Sudan by Wage/Income Gap
In terms of wage/income gap, the demographic groups most similar to Immigrants from Sudan are Kiowa (23.6%, a difference of 0.090%), Cape Verdean (23.6%, a difference of 0.21%), Honduran (23.6%, a difference of 0.24%), Immigrants from Cabo Verde (23.6%, a difference of 0.33%), and Immigrants from Latin America (23.7%, a difference of 0.40%).
| Demographics | Rating | Rank | Wage/Income Gap |
| Nicaraguans | 99.6 /100 | #90 | Exceptional 23.4% |
| Arapaho | 99.6 /100 | #91 | Exceptional 23.5% |
| Immigrants | Honduras | 99.5 /100 | #92 | Exceptional 23.5% |
| Immigrants | Cabo Verde | 99.5 /100 | #93 | Exceptional 23.6% |
| Hondurans | 99.5 /100 | #94 | Exceptional 23.6% |
| Cape Verdeans | 99.4 /100 | #95 | Exceptional 23.6% |
| Kiowa | 99.4 /100 | #96 | Exceptional 23.6% |
| Immigrants | Sudan | 99.4 /100 | #97 | Exceptional 23.6% |
| Immigrants | Latin America | 99.2 /100 | #98 | Exceptional 23.7% |
| Aleuts | 99.2 /100 | #99 | Exceptional 23.7% |
| Yakama | 99.2 /100 | #100 | Exceptional 23.7% |
| Japanese | 99.1 /100 | #101 | Exceptional 23.8% |
| Immigrants | Laos | 99.0 /100 | #102 | Exceptional 23.8% |
| Tsimshian | 98.9 /100 | #103 | Exceptional 23.9% |
| Tlingit-Haida | 98.7 /100 | #104 | Exceptional 24.0% |