Pima vs Immigrants from Sudan Wage/Income Gap
COMPARE
Pima
Immigrants from Sudan
Wage/Income Gap
Wage/Income Gap Comparison
Pima
Immigrants from Sudan
21.1%
WAGE/INCOME GAP
100.0/ 100
METRIC RATING
34th/ 347
METRIC RANK
23.6%
WAGE/INCOME GAP
99.4/ 100
METRIC RATING
97th/ 347
METRIC RANK
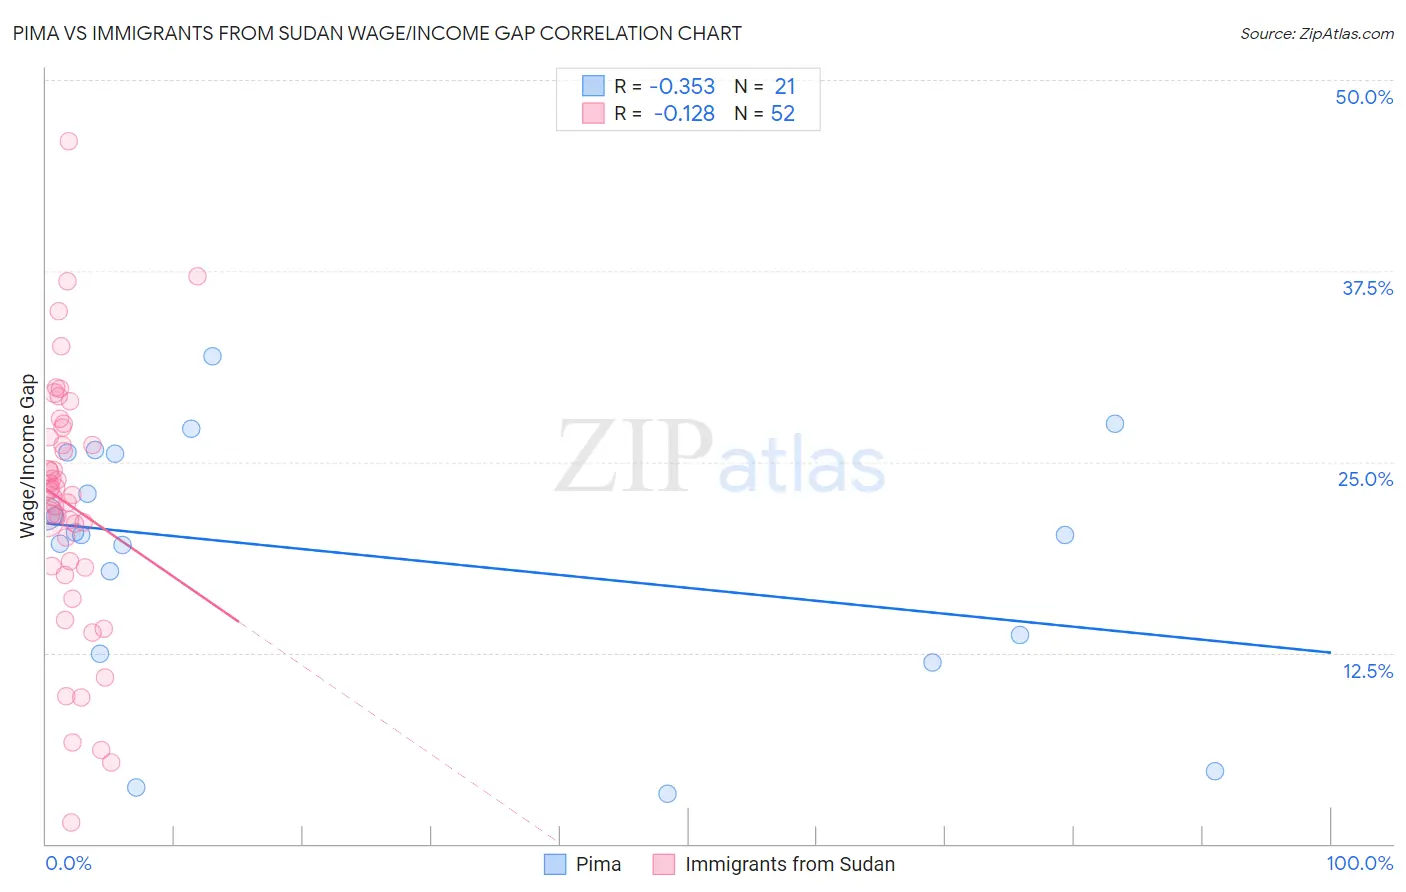
Pima vs Immigrants from Sudan Wage/Income Gap Correlation Chart
The statistical analysis conducted on geographies consisting of 61,509,383 people shows a mild negative correlation between the proportion of Pima and wage/income gap percentage in the United States with a correlation coefficient (R) of -0.353 and weighted average of 21.1%. Similarly, the statistical analysis conducted on geographies consisting of 118,934,661 people shows a poor negative correlation between the proportion of Immigrants from Sudan and wage/income gap percentage in the United States with a correlation coefficient (R) of -0.128 and weighted average of 23.6%, a difference of 11.9%.
Wage/Income Gap Correlation Summary
| Measurement | Pima | Immigrants from Sudan |
| Minimum | 3.3% | 1.4% |
| Maximum | 31.9% | 46.0% |
| Range | 28.6% | 44.6% |
| Mean | 18.9% | 22.2% |
| Median | 20.2% | 23.0% |
| Interquartile 25% (IQ1) | 13.1% | 18.1% |
| Interquartile 75% (IQ3) | 25.6% | 26.9% |
| Interquartile Range (IQR) | 12.5% | 8.8% |
| Standard Deviation (Sample) | 8.0% | 8.5% |
| Standard Deviation (Population) | 7.8% | 8.4% |
Similar Demographics by Wage/Income Gap
Demographics Similar to Pima by Wage/Income Gap
In terms of wage/income gap, the demographic groups most similar to Pima are Immigrants from Bahamas (21.1%, a difference of 0.28%), Immigrants from Yemen (21.1%, a difference of 0.30%), Vietnamese (21.0%, a difference of 0.53%), Somali (21.2%, a difference of 0.55%), and Belizean (21.2%, a difference of 0.57%).
| Demographics | Rating | Rank | Wage/Income Gap |
| Immigrants | Armenia | 100.0 /100 | #27 | Exceptional 20.7% |
| Inupiat | 100.0 /100 | #28 | Exceptional 20.8% |
| Immigrants | Senegal | 100.0 /100 | #29 | Exceptional 20.9% |
| Immigrants | Bangladesh | 100.0 /100 | #30 | Exceptional 20.9% |
| Vietnamese | 100.0 /100 | #31 | Exceptional 21.0% |
| Immigrants | Yemen | 100.0 /100 | #32 | Exceptional 21.1% |
| Immigrants | Bahamas | 100.0 /100 | #33 | Exceptional 21.1% |
| Pima | 100.0 /100 | #34 | Exceptional 21.1% |
| Somalis | 100.0 /100 | #35 | Exceptional 21.2% |
| Belizeans | 100.0 /100 | #36 | Exceptional 21.2% |
| Immigrants | Somalia | 100.0 /100 | #37 | Exceptional 21.2% |
| Immigrants | Belize | 100.0 /100 | #38 | Exceptional 21.3% |
| Colville | 100.0 /100 | #39 | Exceptional 21.3% |
| Lumbee | 100.0 /100 | #40 | Exceptional 21.3% |
| Liberians | 100.0 /100 | #41 | Exceptional 21.4% |
Demographics Similar to Immigrants from Sudan by Wage/Income Gap
In terms of wage/income gap, the demographic groups most similar to Immigrants from Sudan are Kiowa (23.6%, a difference of 0.090%), Cape Verdean (23.6%, a difference of 0.21%), Honduran (23.6%, a difference of 0.24%), Immigrants from Cabo Verde (23.6%, a difference of 0.33%), and Immigrants from Latin America (23.7%, a difference of 0.40%).
| Demographics | Rating | Rank | Wage/Income Gap |
| Nicaraguans | 99.6 /100 | #90 | Exceptional 23.4% |
| Arapaho | 99.6 /100 | #91 | Exceptional 23.5% |
| Immigrants | Honduras | 99.5 /100 | #92 | Exceptional 23.5% |
| Immigrants | Cabo Verde | 99.5 /100 | #93 | Exceptional 23.6% |
| Hondurans | 99.5 /100 | #94 | Exceptional 23.6% |
| Cape Verdeans | 99.4 /100 | #95 | Exceptional 23.6% |
| Kiowa | 99.4 /100 | #96 | Exceptional 23.6% |
| Immigrants | Sudan | 99.4 /100 | #97 | Exceptional 23.6% |
| Immigrants | Latin America | 99.2 /100 | #98 | Exceptional 23.7% |
| Aleuts | 99.2 /100 | #99 | Exceptional 23.7% |
| Yakama | 99.2 /100 | #100 | Exceptional 23.7% |
| Japanese | 99.1 /100 | #101 | Exceptional 23.8% |
| Immigrants | Laos | 99.0 /100 | #102 | Exceptional 23.8% |
| Tsimshian | 98.9 /100 | #103 | Exceptional 23.9% |
| Tlingit-Haida | 98.7 /100 | #104 | Exceptional 24.0% |