Peruvian vs Immigrants from Netherlands Wage/Income Gap
COMPARE
Peruvian
Immigrants from Netherlands
Wage/Income Gap
Wage/Income Gap Comparison
Peruvians
Immigrants from Netherlands
25.6%
WAGE/INCOME GAP
60.1/ 100
METRIC RATING
169th/ 347
METRIC RANK
28.5%
WAGE/INCOME GAP
0.2/ 100
METRIC RATING
304th/ 347
METRIC RANK
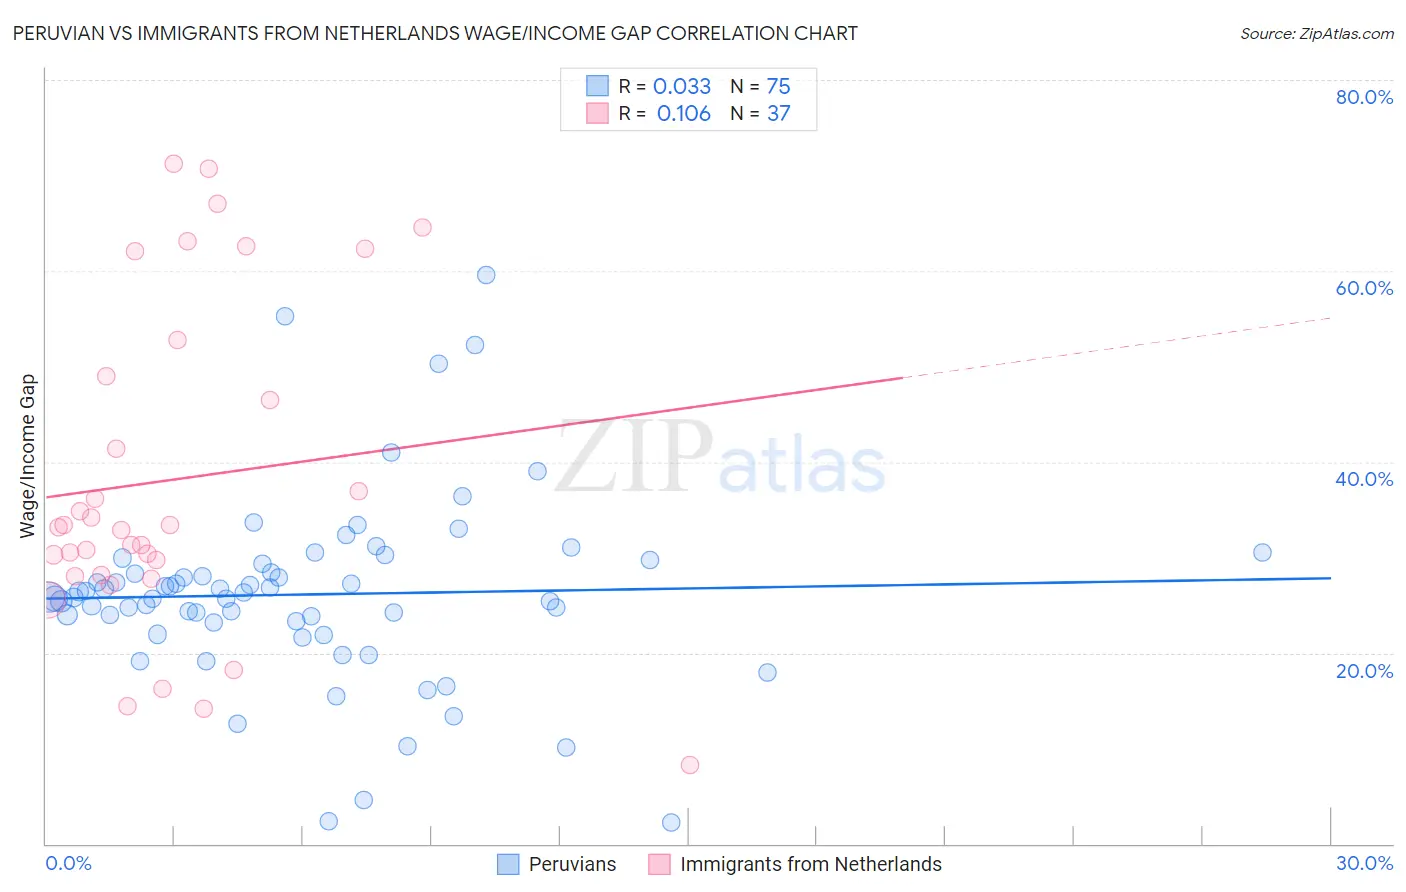
Peruvian vs Immigrants from Netherlands Wage/Income Gap Correlation Chart
The statistical analysis conducted on geographies consisting of 363,114,915 people shows no correlation between the proportion of Peruvians and wage/income gap percentage in the United States with a correlation coefficient (R) of 0.033 and weighted average of 25.6%. Similarly, the statistical analysis conducted on geographies consisting of 237,766,220 people shows a poor positive correlation between the proportion of Immigrants from Netherlands and wage/income gap percentage in the United States with a correlation coefficient (R) of 0.106 and weighted average of 28.5%, a difference of 11.3%.
Wage/Income Gap Correlation Summary
| Measurement | Peruvian | Immigrants from Netherlands |
| Minimum | 2.2% | 8.2% |
| Maximum | 59.6% | 71.2% |
| Range | 57.4% | 63.0% |
| Mean | 26.1% | 38.1% |
| Median | 25.9% | 33.2% |
| Interquartile 25% (IQ1) | 23.1% | 28.1% |
| Interquartile 75% (IQ3) | 29.3% | 50.9% |
| Interquartile Range (IQR) | 6.2% | 22.8% |
| Standard Deviation (Sample) | 9.9% | 17.1% |
| Standard Deviation (Population) | 9.8% | 16.9% |
Similar Demographics by Wage/Income Gap
Demographics Similar to Peruvians by Wage/Income Gap
In terms of wage/income gap, the demographic groups most similar to Peruvians are Immigrants from Oceania (25.6%, a difference of 0.17%), Seminole (25.6%, a difference of 0.18%), Paiute (25.5%, a difference of 0.20%), Immigrants from Greece (25.7%, a difference of 0.23%), and Immigrants from Ukraine (25.5%, a difference of 0.26%).
| Demographics | Rating | Rank | Wage/Income Gap |
| Shoshone | 69.0 /100 | #162 | Good 25.4% |
| Native Hawaiians | 69.0 /100 | #163 | Good 25.4% |
| Koreans | 68.6 /100 | #164 | Good 25.4% |
| Immigrants | Hong Kong | 64.0 /100 | #165 | Good 25.5% |
| Immigrants | Ukraine | 63.8 /100 | #166 | Good 25.5% |
| Paiute | 62.9 /100 | #167 | Good 25.5% |
| Seminole | 62.6 /100 | #168 | Good 25.6% |
| Peruvians | 60.1 /100 | #169 | Good 25.6% |
| Immigrants | Oceania | 57.5 /100 | #170 | Average 25.6% |
| Immigrants | Greece | 56.6 /100 | #171 | Average 25.7% |
| Immigrants | Chile | 53.2 /100 | #172 | Average 25.7% |
| Immigrants | Belarus | 52.9 /100 | #173 | Average 25.7% |
| Alaskan Athabascans | 50.0 /100 | #174 | Average 25.8% |
| Sri Lankans | 47.0 /100 | #175 | Average 25.8% |
| Paraguayans | 46.7 /100 | #176 | Average 25.8% |
Demographics Similar to Immigrants from Netherlands by Wage/Income Gap
In terms of wage/income gap, the demographic groups most similar to Immigrants from Netherlands are Immigrants from South Africa (28.5%, a difference of 0.020%), White/Caucasian (28.5%, a difference of 0.060%), Immigrants from Denmark (28.5%, a difference of 0.070%), Scotch-Irish (28.5%, a difference of 0.080%), and Irish (28.5%, a difference of 0.080%).
| Demographics | Rating | Rank | Wage/Income Gap |
| Immigrants | North America | 0.2 /100 | #297 | Tragic 28.4% |
| Austrians | 0.2 /100 | #298 | Tragic 28.4% |
| Immigrants | North Macedonia | 0.2 /100 | #299 | Tragic 28.4% |
| Immigrants | Northern Europe | 0.2 /100 | #300 | Tragic 28.5% |
| Immigrants | Canada | 0.2 /100 | #301 | Tragic 28.5% |
| Scotch-Irish | 0.2 /100 | #302 | Tragic 28.5% |
| Irish | 0.2 /100 | #303 | Tragic 28.5% |
| Immigrants | Netherlands | 0.2 /100 | #304 | Tragic 28.5% |
| Immigrants | South Africa | 0.1 /100 | #305 | Tragic 28.5% |
| Whites/Caucasians | 0.1 /100 | #306 | Tragic 28.5% |
| Immigrants | Denmark | 0.1 /100 | #307 | Tragic 28.5% |
| Poles | 0.1 /100 | #308 | Tragic 28.5% |
| Macedonians | 0.1 /100 | #309 | Tragic 28.6% |
| Finns | 0.1 /100 | #310 | Tragic 28.6% |
| Immigrants | Lithuania | 0.1 /100 | #311 | Tragic 28.6% |