New Zealander vs Immigrants from Sudan Wage/Income Gap
COMPARE
New Zealander
Immigrants from Sudan
Wage/Income Gap
Wage/Income Gap Comparison
New Zealanders
Immigrants from Sudan
27.7%
WAGE/INCOME GAP
1.0/ 100
METRIC RATING
268th/ 347
METRIC RANK
23.6%
WAGE/INCOME GAP
99.4/ 100
METRIC RATING
97th/ 347
METRIC RANK
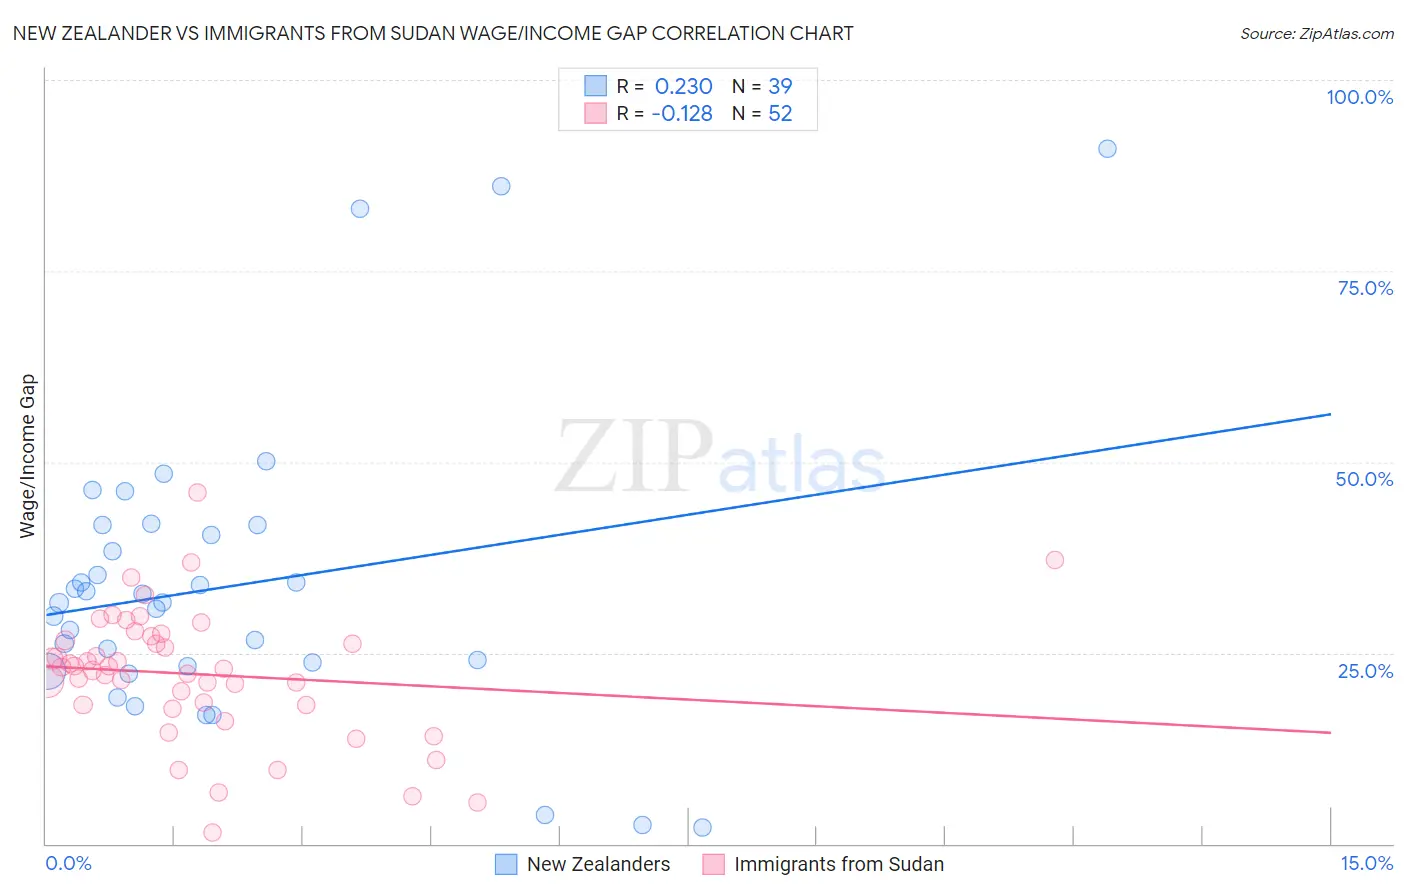
New Zealander vs Immigrants from Sudan Wage/Income Gap Correlation Chart
The statistical analysis conducted on geographies consisting of 106,903,944 people shows a weak positive correlation between the proportion of New Zealanders and wage/income gap percentage in the United States with a correlation coefficient (R) of 0.230 and weighted average of 27.7%. Similarly, the statistical analysis conducted on geographies consisting of 118,934,661 people shows a poor negative correlation between the proportion of Immigrants from Sudan and wage/income gap percentage in the United States with a correlation coefficient (R) of -0.128 and weighted average of 23.6%, a difference of 17.3%.
Wage/Income Gap Correlation Summary
| Measurement | New Zealander | Immigrants from Sudan |
| Minimum | 2.1% | 1.4% |
| Maximum | 91.0% | 46.0% |
| Range | 88.9% | 44.6% |
| Mean | 33.8% | 22.2% |
| Median | 31.6% | 23.0% |
| Interquartile 25% (IQ1) | 23.2% | 18.1% |
| Interquartile 75% (IQ3) | 41.8% | 26.9% |
| Interquartile Range (IQR) | 18.5% | 8.8% |
| Standard Deviation (Sample) | 19.3% | 8.5% |
| Standard Deviation (Population) | 19.1% | 8.4% |
Similar Demographics by Wage/Income Gap
Demographics Similar to New Zealanders by Wage/Income Gap
In terms of wage/income gap, the demographic groups most similar to New Zealanders are Potawatomi (27.7%, a difference of 0.010%), Turkish (27.7%, a difference of 0.080%), Immigrants from Switzerland (27.7%, a difference of 0.10%), Serbian (27.7%, a difference of 0.10%), and Hmong (27.7%, a difference of 0.10%).
| Demographics | Rating | Rank | Wage/Income Gap |
| Immigrants | Germany | 1.5 /100 | #261 | Tragic 27.5% |
| Immigrants | Lebanon | 1.5 /100 | #262 | Tragic 27.5% |
| Syrians | 1.4 /100 | #263 | Tragic 27.6% |
| Immigrants | Switzerland | 1.0 /100 | #264 | Tragic 27.7% |
| Serbians | 1.0 /100 | #265 | Tragic 27.7% |
| Hmong | 1.0 /100 | #266 | Tragic 27.7% |
| Turks | 1.0 /100 | #267 | Tragic 27.7% |
| New Zealanders | 1.0 /100 | #268 | Tragic 27.7% |
| Potawatomi | 0.9 /100 | #269 | Tragic 27.7% |
| Immigrants | Western Europe | 0.9 /100 | #270 | Tragic 27.8% |
| Ute | 0.8 /100 | #271 | Tragic 27.8% |
| Immigrants | Korea | 0.8 /100 | #272 | Tragic 27.8% |
| Bulgarians | 0.7 /100 | #273 | Tragic 27.8% |
| Americans | 0.7 /100 | #274 | Tragic 27.8% |
| Immigrants | Japan | 0.7 /100 | #275 | Tragic 27.9% |
Demographics Similar to Immigrants from Sudan by Wage/Income Gap
In terms of wage/income gap, the demographic groups most similar to Immigrants from Sudan are Kiowa (23.6%, a difference of 0.090%), Cape Verdean (23.6%, a difference of 0.21%), Honduran (23.6%, a difference of 0.24%), Immigrants from Cabo Verde (23.6%, a difference of 0.33%), and Immigrants from Latin America (23.7%, a difference of 0.40%).
| Demographics | Rating | Rank | Wage/Income Gap |
| Nicaraguans | 99.6 /100 | #90 | Exceptional 23.4% |
| Arapaho | 99.6 /100 | #91 | Exceptional 23.5% |
| Immigrants | Honduras | 99.5 /100 | #92 | Exceptional 23.5% |
| Immigrants | Cabo Verde | 99.5 /100 | #93 | Exceptional 23.6% |
| Hondurans | 99.5 /100 | #94 | Exceptional 23.6% |
| Cape Verdeans | 99.4 /100 | #95 | Exceptional 23.6% |
| Kiowa | 99.4 /100 | #96 | Exceptional 23.6% |
| Immigrants | Sudan | 99.4 /100 | #97 | Exceptional 23.6% |
| Immigrants | Latin America | 99.2 /100 | #98 | Exceptional 23.7% |
| Aleuts | 99.2 /100 | #99 | Exceptional 23.7% |
| Yakama | 99.2 /100 | #100 | Exceptional 23.7% |
| Japanese | 99.1 /100 | #101 | Exceptional 23.8% |
| Immigrants | Laos | 99.0 /100 | #102 | Exceptional 23.8% |
| Tsimshian | 98.9 /100 | #103 | Exceptional 23.9% |
| Tlingit-Haida | 98.7 /100 | #104 | Exceptional 24.0% |