Navajo vs Immigrants from Sudan Professional Degree
COMPARE
Navajo
Immigrants from Sudan
Professional Degree
Professional Degree Comparison
Navajo
Immigrants from Sudan
2.9%
PROFESSIONAL DEGREE
0.0/ 100
METRIC RATING
338th/ 347
METRIC RANK
4.9%
PROFESSIONAL DEGREE
95.4/ 100
METRIC RATING
119th/ 347
METRIC RANK
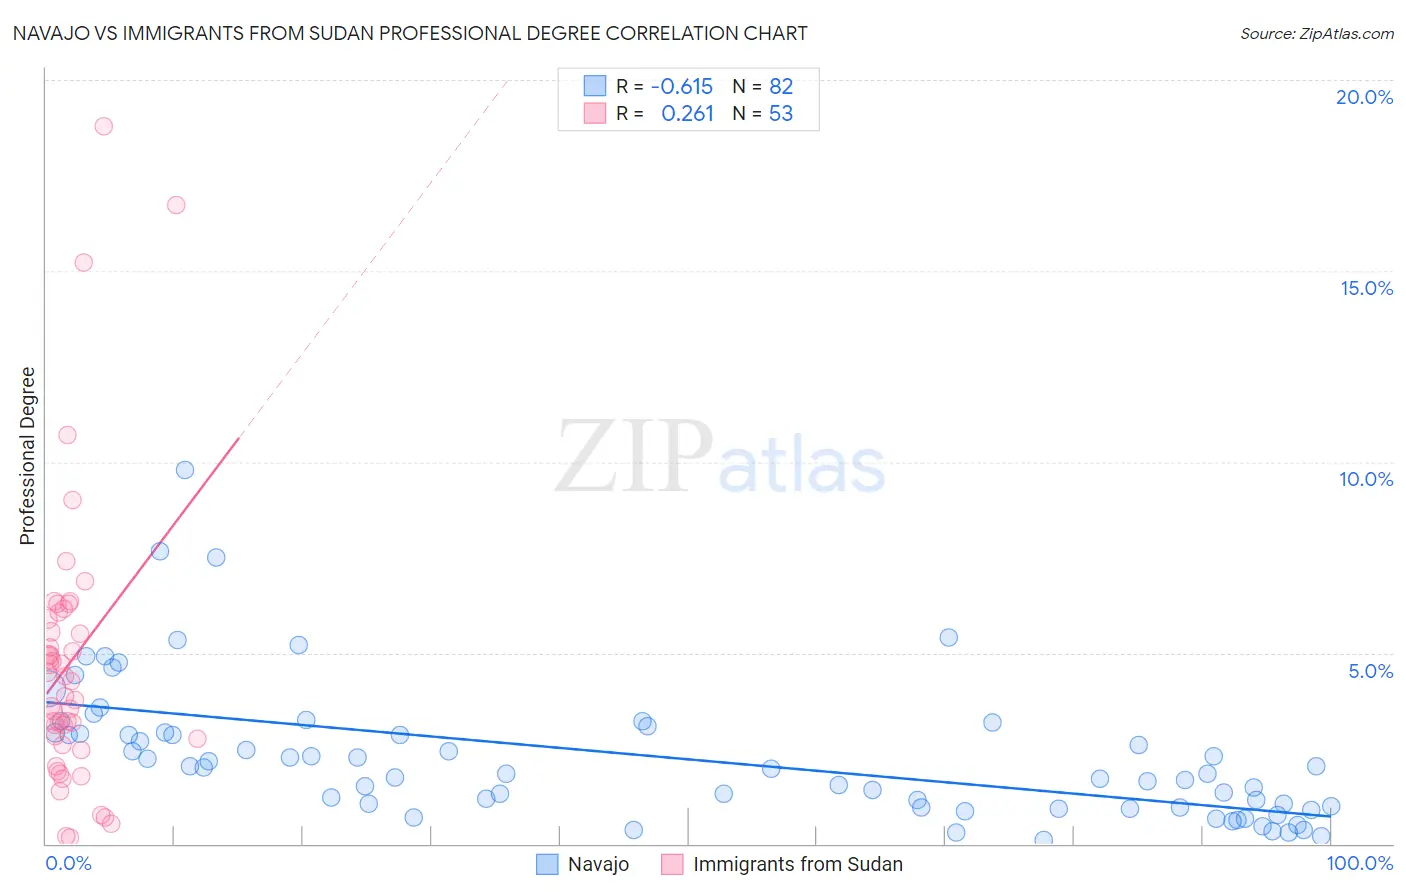
Navajo vs Immigrants from Sudan Professional Degree Correlation Chart
The statistical analysis conducted on geographies consisting of 224,034,361 people shows a significant negative correlation between the proportion of Navajo and percentage of population with at least professional degree education in the United States with a correlation coefficient (R) of -0.615 and weighted average of 2.9%. Similarly, the statistical analysis conducted on geographies consisting of 118,905,471 people shows a weak positive correlation between the proportion of Immigrants from Sudan and percentage of population with at least professional degree education in the United States with a correlation coefficient (R) of 0.261 and weighted average of 4.9%, a difference of 70.2%.
Professional Degree Correlation Summary
| Measurement | Navajo | Immigrants from Sudan |
| Minimum | 0.11% | 0.17% |
| Maximum | 9.8% | 18.8% |
| Range | 9.7% | 18.6% |
| Mean | 2.3% | 4.8% |
| Median | 1.9% | 4.2% |
| Interquartile 25% (IQ1) | 0.96% | 2.7% |
| Interquartile 75% (IQ3) | 2.9% | 6.0% |
| Interquartile Range (IQR) | 1.9% | 3.3% |
| Standard Deviation (Sample) | 1.8% | 3.7% |
| Standard Deviation (Population) | 1.8% | 3.7% |
Similar Demographics by Professional Degree
Demographics Similar to Navajo by Professional Degree
In terms of professional degree, the demographic groups most similar to Navajo are Arapaho (2.9%, a difference of 0.070%), Immigrants from Central America (2.9%, a difference of 0.12%), Yup'ik (2.9%, a difference of 0.17%), Tohono O'odham (2.8%, a difference of 0.95%), and Immigrants from the Azores (2.8%, a difference of 1.6%).
| Demographics | Rating | Rank | Professional Degree |
| Kiowa | 0.0 /100 | #331 | Tragic 3.1% |
| Yakama | 0.0 /100 | #332 | Tragic 3.1% |
| Puget Sound Salish | 0.0 /100 | #333 | Tragic 3.1% |
| Pennsylvania Germans | 0.0 /100 | #334 | Tragic 3.0% |
| Natives/Alaskans | 0.0 /100 | #335 | Tragic 3.0% |
| Fijians | 0.0 /100 | #336 | Tragic 2.9% |
| Arapaho | 0.0 /100 | #337 | Tragic 2.9% |
| Navajo | 0.0 /100 | #338 | Tragic 2.9% |
| Immigrants | Central America | 0.0 /100 | #339 | Tragic 2.9% |
| Yup'ik | 0.0 /100 | #340 | Tragic 2.9% |
| Tohono O'odham | 0.0 /100 | #341 | Tragic 2.8% |
| Immigrants | Azores | 0.0 /100 | #342 | Tragic 2.8% |
| Mexicans | 0.0 /100 | #343 | Tragic 2.7% |
| Spanish American Indians | 0.0 /100 | #344 | Tragic 2.7% |
| Immigrants | Mexico | 0.0 /100 | #345 | Tragic 2.6% |
Demographics Similar to Immigrants from Sudan by Professional Degree
In terms of professional degree, the demographic groups most similar to Immigrants from Sudan are Albanian (4.9%, a difference of 0.010%), Immigrants from Moldova (4.9%, a difference of 0.36%), Immigrants from Syria (4.9%, a difference of 0.54%), Croatian (4.9%, a difference of 0.54%), and Venezuelan (4.9%, a difference of 0.75%).
| Demographics | Rating | Rank | Professional Degree |
| Taiwanese | 97.3 /100 | #112 | Exceptional 5.0% |
| Immigrants | Pakistan | 97.2 /100 | #113 | Exceptional 5.0% |
| Immigrants | Morocco | 96.8 /100 | #114 | Exceptional 5.0% |
| Moroccans | 96.8 /100 | #115 | Exceptional 5.0% |
| Venezuelans | 96.3 /100 | #116 | Exceptional 4.9% |
| Immigrants | Syria | 96.0 /100 | #117 | Exceptional 4.9% |
| Croatians | 96.0 /100 | #118 | Exceptional 4.9% |
| Immigrants | Sudan | 95.4 /100 | #119 | Exceptional 4.9% |
| Albanians | 95.3 /100 | #120 | Exceptional 4.9% |
| Immigrants | Moldova | 94.8 /100 | #121 | Exceptional 4.9% |
| Immigrants | Germany | 94.1 /100 | #122 | Exceptional 4.9% |
| Immigrants | Venezuela | 93.8 /100 | #123 | Exceptional 4.8% |
| Immigrants | Eritrea | 93.5 /100 | #124 | Exceptional 4.8% |
| Immigrants | Albania | 93.3 /100 | #125 | Exceptional 4.8% |
| Europeans | 93.2 /100 | #126 | Exceptional 4.8% |