Marshallese vs Chippewa Wage/Income Gap
COMPARE
Marshallese
Chippewa
Wage/Income Gap
Wage/Income Gap Comparison
Marshallese
Chippewa
23.4%
WAGE/INCOME GAP
99.6/ 100
METRIC RATING
89th/ 347
METRIC RANK
25.0%
WAGE/INCOME GAP
86.9/ 100
METRIC RATING
144th/ 347
METRIC RANK
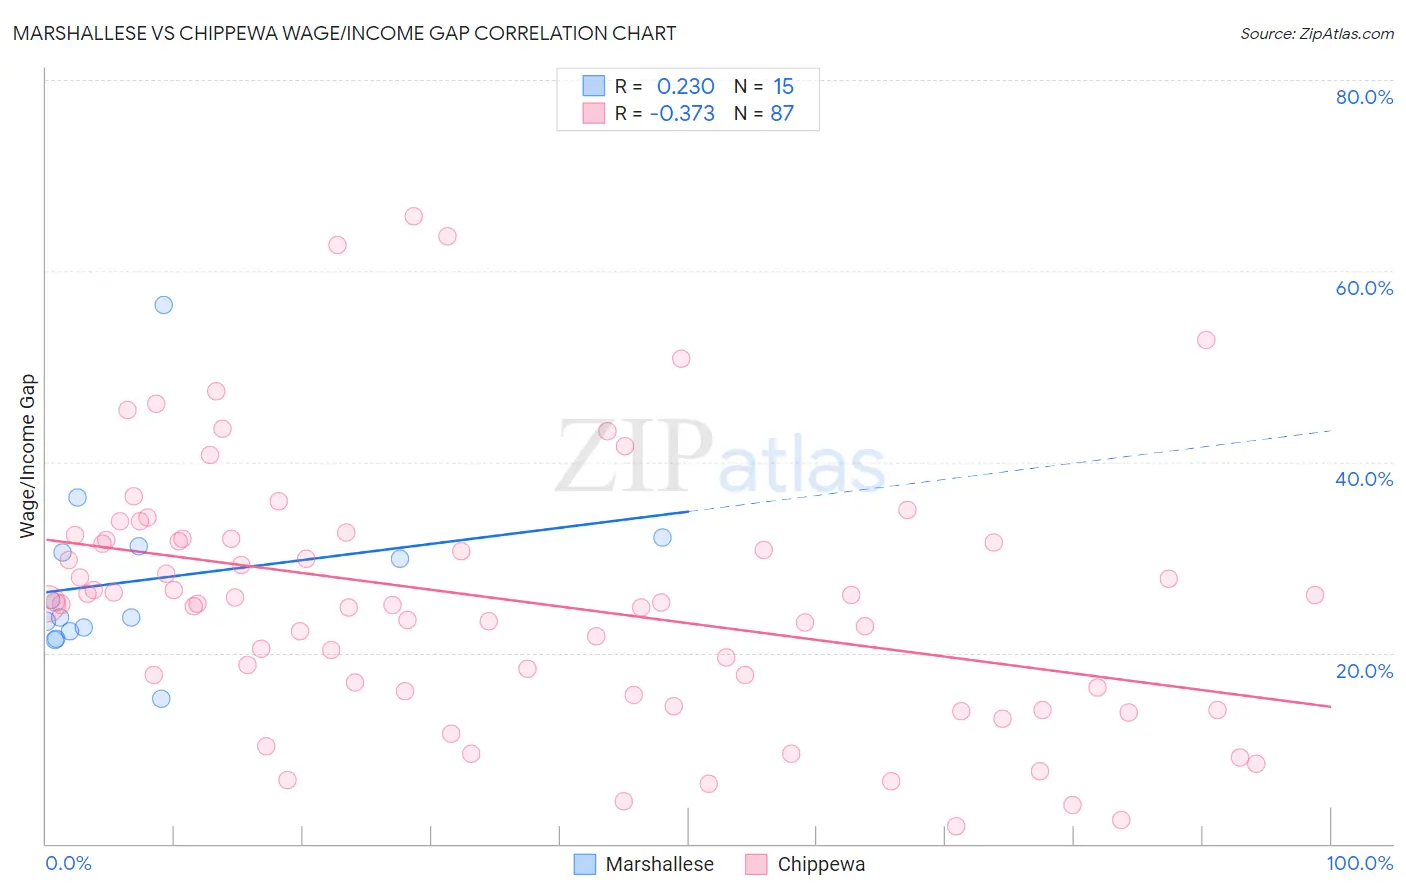
Marshallese vs Chippewa Wage/Income Gap Correlation Chart
The statistical analysis conducted on geographies consisting of 14,760,329 people shows a weak positive correlation between the proportion of Marshallese and wage/income gap percentage in the United States with a correlation coefficient (R) of 0.230 and weighted average of 23.4%. Similarly, the statistical analysis conducted on geographies consisting of 214,916,578 people shows a mild negative correlation between the proportion of Chippewa and wage/income gap percentage in the United States with a correlation coefficient (R) of -0.373 and weighted average of 25.0%, a difference of 6.6%.
Wage/Income Gap Correlation Summary
| Measurement | Marshallese | Chippewa |
| Minimum | 15.1% | 1.9% |
| Maximum | 56.5% | 65.8% |
| Range | 41.4% | 63.9% |
| Mean | 27.7% | 25.6% |
| Median | 23.7% | 25.2% |
| Interquartile 25% (IQ1) | 22.2% | 16.0% |
| Interquartile 75% (IQ3) | 31.2% | 31.9% |
| Interquartile Range (IQR) | 8.9% | 15.9% |
| Standard Deviation (Sample) | 9.6% | 13.5% |
| Standard Deviation (Population) | 9.3% | 13.4% |
Similar Demographics by Wage/Income Gap
Demographics Similar to Marshallese by Wage/Income Gap
In terms of wage/income gap, the demographic groups most similar to Marshallese are Nicaraguan (23.4%, a difference of 0.010%), Immigrants from Panama (23.4%, a difference of 0.090%), Arapaho (23.5%, a difference of 0.15%), Immigrants from Honduras (23.5%, a difference of 0.30%), and Yuman (23.3%, a difference of 0.41%).
| Demographics | Rating | Rank | Wage/Income Gap |
| Central Americans | 99.8 /100 | #82 | Exceptional 23.1% |
| Immigrants | Africa | 99.8 /100 | #83 | Exceptional 23.2% |
| Cubans | 99.7 /100 | #84 | Exceptional 23.3% |
| Immigrants | Cambodia | 99.7 /100 | #85 | Exceptional 23.3% |
| Cheyenne | 99.7 /100 | #86 | Exceptional 23.3% |
| Yuman | 99.7 /100 | #87 | Exceptional 23.3% |
| Immigrants | Panama | 99.6 /100 | #88 | Exceptional 23.4% |
| Marshallese | 99.6 /100 | #89 | Exceptional 23.4% |
| Nicaraguans | 99.6 /100 | #90 | Exceptional 23.4% |
| Arapaho | 99.6 /100 | #91 | Exceptional 23.5% |
| Immigrants | Honduras | 99.5 /100 | #92 | Exceptional 23.5% |
| Immigrants | Cabo Verde | 99.5 /100 | #93 | Exceptional 23.6% |
| Hondurans | 99.5 /100 | #94 | Exceptional 23.6% |
| Cape Verdeans | 99.4 /100 | #95 | Exceptional 23.6% |
| Kiowa | 99.4 /100 | #96 | Exceptional 23.6% |
Demographics Similar to Chippewa by Wage/Income Gap
In terms of wage/income gap, the demographic groups most similar to Chippewa are Immigrants from Uganda (24.9%, a difference of 0.18%), Afghan (24.9%, a difference of 0.19%), Comanche (25.0%, a difference of 0.24%), South American (25.0%, a difference of 0.24%), and Malaysian (25.0%, a difference of 0.27%).
| Demographics | Rating | Rank | Wage/Income Gap |
| Immigrants | South Eastern Asia | 90.9 /100 | #137 | Exceptional 24.8% |
| Immigrants | Bosnia and Herzegovina | 90.1 /100 | #138 | Exceptional 24.8% |
| Hispanics or Latinos | 89.5 /100 | #139 | Excellent 24.9% |
| Immigrants | Nepal | 89.3 /100 | #140 | Excellent 24.9% |
| Hawaiians | 89.3 /100 | #141 | Excellent 24.9% |
| Afghans | 88.1 /100 | #142 | Excellent 24.9% |
| Immigrants | Uganda | 88.0 /100 | #143 | Excellent 24.9% |
| Chippewa | 86.9 /100 | #144 | Excellent 25.0% |
| Comanche | 85.2 /100 | #145 | Excellent 25.0% |
| South Americans | 85.2 /100 | #146 | Excellent 25.0% |
| Malaysians | 84.9 /100 | #147 | Excellent 25.0% |
| Iroquois | 83.9 /100 | #148 | Excellent 25.1% |
| Immigrants | Peru | 82.6 /100 | #149 | Excellent 25.1% |
| Immigrants | Immigrants | 82.3 /100 | #150 | Excellent 25.1% |
| Taiwanese | 81.6 /100 | #151 | Excellent 25.1% |