Native Hawaiian vs Chippewa Wage/Income Gap
COMPARE
Native Hawaiian
Chippewa
Wage/Income Gap
Wage/Income Gap Comparison
Native Hawaiians
Chippewa
25.4%
WAGE/INCOME GAP
69.0/ 100
METRIC RATING
163rd/ 347
METRIC RANK
25.0%
WAGE/INCOME GAP
86.9/ 100
METRIC RATING
144th/ 347
METRIC RANK
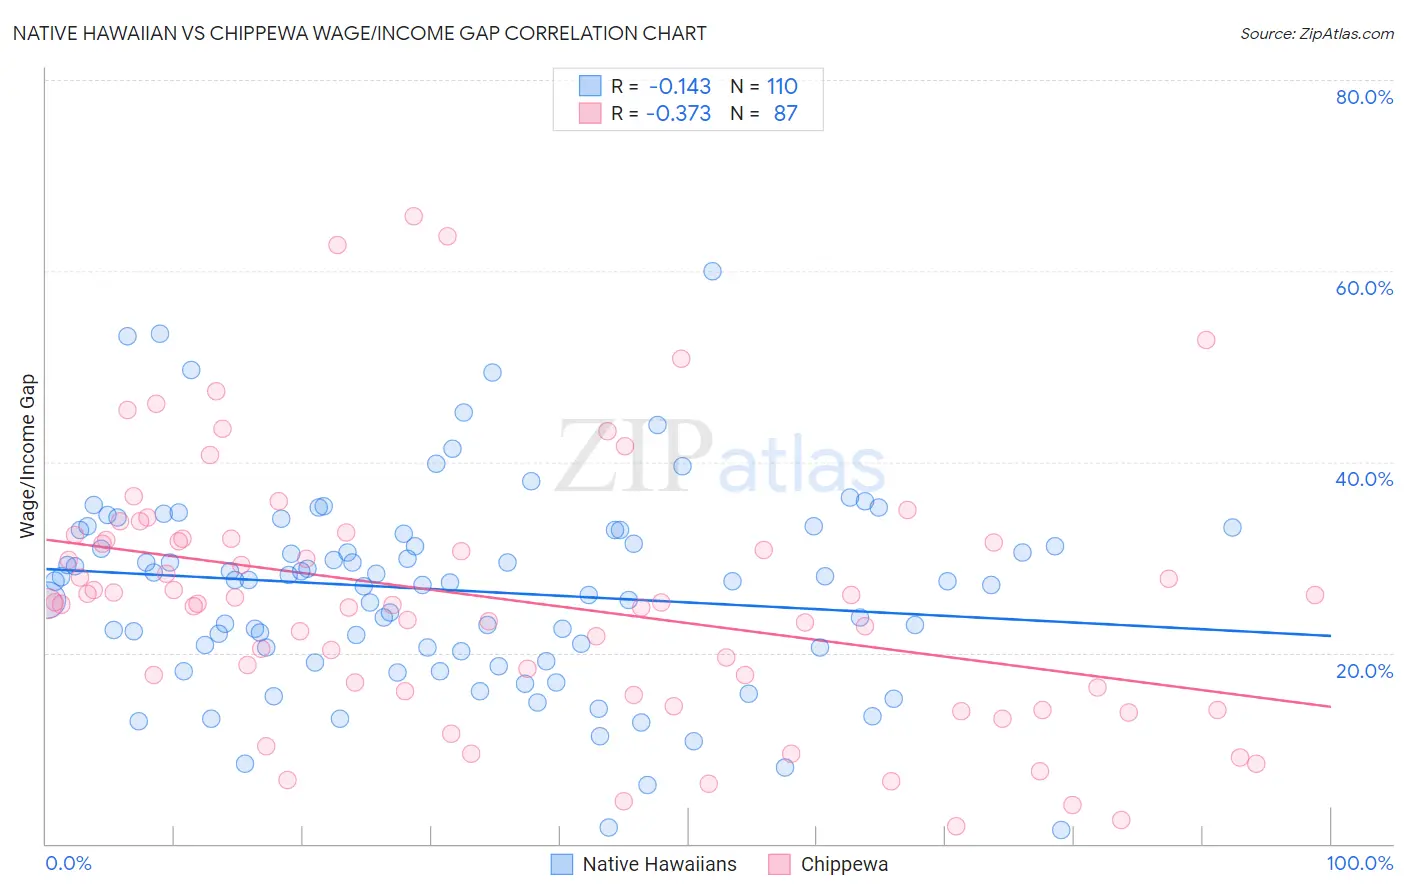
Native Hawaiian vs Chippewa Wage/Income Gap Correlation Chart
The statistical analysis conducted on geographies consisting of 331,867,759 people shows a poor negative correlation between the proportion of Native Hawaiians and wage/income gap percentage in the United States with a correlation coefficient (R) of -0.143 and weighted average of 25.4%. Similarly, the statistical analysis conducted on geographies consisting of 214,916,578 people shows a mild negative correlation between the proportion of Chippewa and wage/income gap percentage in the United States with a correlation coefficient (R) of -0.373 and weighted average of 25.0%, a difference of 1.8%.
Wage/Income Gap Correlation Summary
| Measurement | Native Hawaiian | Chippewa |
| Minimum | 1.4% | 1.9% |
| Maximum | 60.0% | 65.8% |
| Range | 58.6% | 63.9% |
| Mean | 26.6% | 25.6% |
| Median | 27.5% | 25.2% |
| Interquartile 25% (IQ1) | 20.6% | 16.0% |
| Interquartile 75% (IQ3) | 32.8% | 31.9% |
| Interquartile Range (IQR) | 12.2% | 15.9% |
| Standard Deviation (Sample) | 10.4% | 13.5% |
| Standard Deviation (Population) | 10.3% | 13.4% |
Demographics Similar to Native Hawaiians and Chippewa by Wage/Income Gap
In terms of wage/income gap, the demographic groups most similar to Native Hawaiians are Shoshone (25.4%, a difference of 0.0%), Albanian (25.4%, a difference of 0.030%), French American Indian (25.4%, a difference of 0.29%), Puget Sound Salish (25.3%, a difference of 0.33%), and Immigrants from Zimbabwe (25.3%, a difference of 0.39%). Similarly, the demographic groups most similar to Chippewa are Immigrants from Uganda (24.9%, a difference of 0.18%), Comanche (25.0%, a difference of 0.24%), South American (25.0%, a difference of 0.24%), Malaysian (25.0%, a difference of 0.27%), and Iroquois (25.1%, a difference of 0.40%).
| Demographics | Rating | Rank | Wage/Income Gap |
| Immigrants | Uganda | 88.0 /100 | #143 | Excellent 24.9% |
| Chippewa | 86.9 /100 | #144 | Excellent 25.0% |
| Comanche | 85.2 /100 | #145 | Excellent 25.0% |
| South Americans | 85.2 /100 | #146 | Excellent 25.0% |
| Malaysians | 84.9 /100 | #147 | Excellent 25.0% |
| Iroquois | 83.9 /100 | #148 | Excellent 25.1% |
| Immigrants | Peru | 82.6 /100 | #149 | Excellent 25.1% |
| Immigrants | Immigrants | 82.3 /100 | #150 | Excellent 25.1% |
| Taiwanese | 81.6 /100 | #151 | Excellent 25.1% |
| Uruguayans | 81.3 /100 | #152 | Excellent 25.2% |
| Blackfeet | 78.1 /100 | #153 | Good 25.2% |
| Immigrants | Northern Africa | 78.1 /100 | #154 | Good 25.2% |
| Immigrants | Vietnam | 77.7 /100 | #155 | Good 25.2% |
| Immigrants | Mexico | 76.4 /100 | #156 | Good 25.3% |
| Costa Ricans | 75.8 /100 | #157 | Good 25.3% |
| Immigrants | Zimbabwe | 73.7 /100 | #158 | Good 25.3% |
| Puget Sound Salish | 73.0 /100 | #159 | Good 25.3% |
| French American Indians | 72.5 /100 | #160 | Good 25.4% |
| Albanians | 69.4 /100 | #161 | Good 25.4% |
| Shoshone | 69.0 /100 | #162 | Good 25.4% |
| Native Hawaiians | 69.0 /100 | #163 | Good 25.4% |