Czech vs Chippewa Wage/Income Gap

COMPARE

Czech
Race
Ancestry
AfghanAfricanAlaska NativeAlaskan AthabascanAlbanianAleutAlsatianAmericanApacheArabArapahoArgentineanArmenianAssyrian/Chaldean/SyriacAustralianAustrianBahamianBangladeshiBarbadianBasqueBelgianBelizeanBermudanBhutaneseBlackfeetBolivianBrazilianBritishBritish West IndianBulgarianBurmeseCajunCambodianCanadianCape VerdeanCarpatho RusynCelticCentral AmericanCentral American IndianCherokeeCheyenneChickasawChileanChineseChoctawColombianColvilleComancheCosta RicanCreeCreekCroatianCrowCubanCypriotCzechCzechoslovakianDanishDelawareDominicanDutchDutch West IndianEastern EuropeanEcuadorianEgyptianEnglishEstonianEthiopianEuropeanFijianFilipinoFinnishFrenchFrench American IndianFrench CanadianGermanGerman RussianGhanaianGreekGuamanian/ChamorroGuatemalanGuyaneseHaitianHmongHonduranHopiHoumaHungarianIcelanderIndian (Asian)IndonesianInupiatIranianIraqiIrishIroquoisIsraeliItalianJamaicanJapaneseJordanianKenyanKiowaKoreanLaotianLatvianLebaneseLiberianLithuanianLumbeeLuxembourgerMacedonianMalaysianMalteseMarshalleseMenomineeMexicanMexican American IndianMongolianMoroccanNative HawaiianNavajoNepaleseNew ZealanderNicaraguanNigerianNorthern EuropeanNorwegianOkinawanOsageOttawaPaiutePakistaniPalestinianPanamanianParaguayanPennsylvania GermanPeruvianPimaPolishPortuguesePotawatomiPuebloPuerto RicanPuget Sound SalishRomanianRussianSalvadoranSamoanScandinavianScotch-IrishScottishSeminoleSenegaleseSerbianShoshoneSierra LeoneanSiouxSlavicSlovakSloveneSomaliSouth AfricanSouth AmericanSouth American IndianSoviet UnionSpaniardSpanishSpanish AmericanSpanish American IndianSri LankanSubsaharan AfricanSudaneseSwedishSwissSyrianTaiwaneseThaiTlingit-HaidaTohono O'OdhamTonganTrinidadian and TobagonianTsimshianTurkishU.S. Virgin IslanderUgandanUkrainianUruguayanUteVenezuelanVietnameseWelshWest IndianYakamaYaquiYugoslavianYumanYup'ikZimbabwean
Immigration
NonimmigrantsImmigrantsAfghanistanAfricaAlbaniaArgentinaArmeniaAsiaAustraliaAustriaBahamasBangladeshBarbadosBelarusBelgiumBelizeBoliviaBosnia and HerzegovinaBrazilBulgariaBurma/MyanmarCabo VerdeCambodiaCameroonCanadaCaribbeanCentral AmericaChileChinaColombiaCongoCosta RicaCroatiaCubaCzechoslovakiaDenmarkDominicaDominican RepublicEastern AfricaEastern AsiaEastern EuropeEcuadorEgyptEl SalvadorEnglandEritreaEthiopiaEuropeFijiFranceGermanyGhanaGreeceGrenadaGuatemalaGuyanaHaitiHondurasHong KongHungaryIndiaIndonesiaIranIraqIrelandIsraelItalyJamaicaJapanJordanKazakhstanKenyaKoreaKuwaitLaosLatin AmericaLatviaLebanonLiberiaLithuaniaMalaysiaMexicoMicronesiaMiddle AfricaMoldovaMoroccoNepalNetherlandsNicaraguaNigeriaNorth AmericaNorth MacedoniaNorthern AfricaNorthern EuropeNorwayOceaniaPakistanPanamaPeruPhilippinesPolandPortugalRomaniaRussiaSaudi ArabiaScotlandSenegalSerbiaSierra LeoneSingaporeSomaliaSouth AfricaSouth AmericaSouth Central AsiaSouth Eastern AsiaSouthern EuropeSpainSri LankaSt. Vincent and the GrenadinesSudanSwedenSwitzerlandSyriaTaiwanThailandTrinidad and TobagoTurkeyUgandaUkraineUruguayUzbekistanVenezuelaVietnamWest IndiesWestern AfricaWestern AsiaWestern EuropeYemenZaireZimbabweAzores
Chippewa
Race
Ancestry
AfghanAfricanAlaska NativeAlaskan AthabascanAlbanianAleutAlsatianAmericanApacheArabArapahoArgentineanArmenianAssyrian/Chaldean/SyriacAustralianAustrianBahamianBangladeshiBarbadianBasqueBelgianBelizeanBermudanBhutaneseBlackfeetBolivianBrazilianBritishBritish West IndianBulgarianBurmeseCajunCambodianCanadianCape VerdeanCarpatho RusynCelticCentral AmericanCentral American IndianCherokeeCheyenneChickasawChileanChineseChippewaChoctawColombianColvilleComancheCosta RicanCreeCreekCroatianCrowCubanCypriotCzechoslovakianDanishDelawareDominicanDutchDutch West IndianEastern EuropeanEcuadorianEgyptianEnglishEstonianEthiopianEuropeanFijianFilipinoFinnishFrenchFrench American IndianFrench CanadianGermanGerman RussianGhanaianGreekGuamanian/ChamorroGuatemalanGuyaneseHaitianHmongHonduranHopiHoumaHungarianIcelanderIndian (Asian)IndonesianInupiatIranianIraqiIrishIroquoisIsraeliItalianJamaicanJapaneseJordanianKenyanKiowaKoreanLaotianLatvianLebaneseLiberianLithuanianLumbeeLuxembourgerMacedonianMalaysianMalteseMarshalleseMenomineeMexicanMexican American IndianMongolianMoroccanNative HawaiianNavajoNepaleseNew ZealanderNicaraguanNigerianNorthern EuropeanNorwegianOkinawanOsageOttawaPaiutePakistaniPalestinianPanamanianParaguayanPennsylvania GermanPeruvianPimaPolishPortuguesePotawatomiPuebloPuerto RicanPuget Sound SalishRomanianRussianSalvadoranSamoanScandinavianScotch-IrishScottishSeminoleSenegaleseSerbianShoshoneSierra LeoneanSiouxSlavicSlovakSloveneSomaliSouth AfricanSouth AmericanSouth American IndianSoviet UnionSpaniardSpanishSpanish AmericanSpanish American IndianSri LankanSubsaharan AfricanSudaneseSwedishSwissSyrianTaiwaneseThaiTlingit-HaidaTohono O'OdhamTonganTrinidadian and TobagonianTsimshianTurkishU.S. Virgin IslanderUgandanUkrainianUruguayanUteVenezuelanVietnameseWelshWest IndianYakamaYaquiYugoslavianYumanYup'ikZimbabwean
Immigration
NonimmigrantsImmigrantsAfghanistanAfricaAlbaniaArgentinaArmeniaAsiaAustraliaAustriaBahamasBangladeshBarbadosBelarusBelgiumBelizeBoliviaBosnia and HerzegovinaBrazilBulgariaBurma/MyanmarCabo VerdeCambodiaCameroonCanadaCaribbeanCentral AmericaChileChinaColombiaCongoCosta RicaCroatiaCubaCzechoslovakiaDenmarkDominicaDominican RepublicEastern AfricaEastern AsiaEastern EuropeEcuadorEgyptEl SalvadorEnglandEritreaEthiopiaEuropeFijiFranceGermanyGhanaGreeceGrenadaGuatemalaGuyanaHaitiHondurasHong KongHungaryIndiaIndonesiaIranIraqIrelandIsraelItalyJamaicaJapanJordanKazakhstanKenyaKoreaKuwaitLaosLatin AmericaLatviaLebanonLiberiaLithuaniaMalaysiaMexicoMicronesiaMiddle AfricaMoldovaMoroccoNepalNetherlandsNicaraguaNigeriaNorth AmericaNorth MacedoniaNorthern AfricaNorthern EuropeNorwayOceaniaPakistanPanamaPeruPhilippinesPolandPortugalRomaniaRussiaSaudi ArabiaScotlandSenegalSerbiaSierra LeoneSingaporeSomaliaSouth AfricaSouth AmericaSouth Central AsiaSouth Eastern AsiaSouthern EuropeSpainSri LankaSt. Vincent and the GrenadinesSudanSwedenSwitzerlandSyriaTaiwanThailandTrinidad and TobagoTurkeyUgandaUkraineUruguayUzbekistanVenezuelaVietnamWest IndiesWestern AfricaWestern AsiaWestern EuropeYemenZaireZimbabweAzores
Wage/Income Gap
Income
Poverty
Unemployment
Labor Participation
Family Structure
Vehicle Availability
Education Level
Disability

Wage/Income Gap Comparison

Czechs

Chippewa

Tragic
Excellent
29.2%
WAGE/INCOME GAP
0.0/ 100
METRIC RATING
331st/ 347
METRIC RANK
25.0%
WAGE/INCOME GAP
86.9/ 100
METRIC RATING
144th/ 347
METRIC RANK

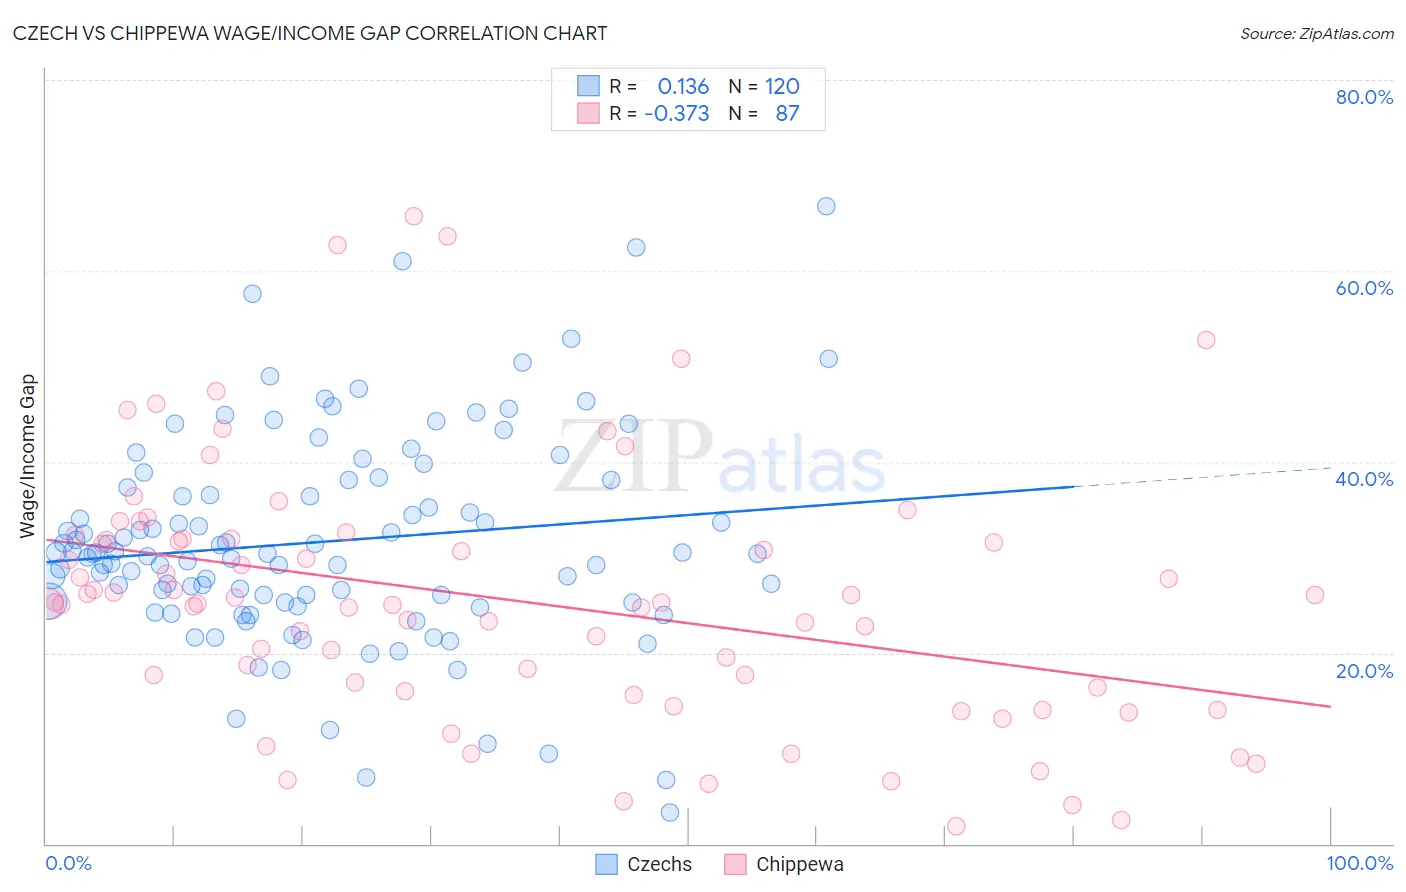
Czech vs Chippewa Wage/Income Gap Correlation Chart

The statistical analysis conducted on geographies consisting of 484,001,232 people shows a poor positive correlation between the proportion of Czechs and wage/income gap percentage in the United States with a correlation coefficient (R) of 0.136 and weighted average of 29.2%. Similarly, the statistical analysis conducted on geographies consisting of 214,916,578 people shows a mild negative correlation between the proportion of Chippewa and wage/income gap percentage in the United States with a correlation coefficient (R) of -0.373 and weighted average of 25.0%, a difference of 16.8%.
Czech vs Chippewa Wage/Income Gap

Wage/Income Gap Correlation Summary

MeasurementCzechChippewa
Minimum3.2%1.9%
Maximum66.7%65.8%
Range63.5%63.9%
Mean31.6%25.6%
Median30.4%25.2%
Interquartile 25% (IQ1)25.4%16.0%
Interquartile 75% (IQ3)37.7%31.9%
Interquartile Range (IQR)12.3%15.9%
Standard Deviation (Sample)11.1%13.5%
Standard Deviation (Population)11.0%13.4%

Similar Demographics by Wage/Income Gap

Demographics Similar to Czechs by Wage/Income Gap

In terms of wage/income gap, the demographic groups most similar to Czechs are German (29.2%, a difference of 0.050%), Scottish (29.1%, a difference of 0.15%), Scandinavian (29.1%, a difference of 0.29%), Immigrants from Iran (29.1%, a difference of 0.35%), and Immigrants from Belgium (29.0%, a difference of 0.46%).
DemographicsRating | RankWage/Income Gap
Croatians
0.0
/100
|
#324
Tragic
29.0%
Hungarians
0.0
/100
|
#325
Tragic
29.0%
Immigrants | Belgium
0.0
/100
|
#326
Tragic
29.0%
Immigrants | Iran
0.0
/100
|
#327
Tragic
29.1%
Scandinavians
0.0
/100
|
#328
Tragic
29.1%
Scottish
0.0
/100
|
#329
Tragic
29.1%
Germans
0.0
/100
|
#330
Tragic
29.2%
Czechs
0.0
/100
|
#331
Tragic
29.2%
Immigrants | South Central Asia
0.0
/100
|
#332
Tragic
29.3%
Europeans
0.0
/100
|
#333
Tragic
29.4%
Swedes
0.0
/100
|
#334
Tragic
29.4%
Immigrants | Taiwan
0.0
/100
|
#335
Tragic
29.5%
English
0.0
/100
|
#336
Tragic
29.5%
Dutch
0.0
/100
|
#337
Tragic
29.6%
Filipinos
0.0
/100
|
#338
Tragic
29.7%

Demographics Similar to Chippewa by Wage/Income Gap

In terms of wage/income gap, the demographic groups most similar to Chippewa are Immigrants from Uganda (24.9%, a difference of 0.18%), Afghan (24.9%, a difference of 0.19%), Comanche (25.0%, a difference of 0.24%), South American (25.0%, a difference of 0.24%), and Malaysian (25.0%, a difference of 0.27%).
DemographicsRating | RankWage/Income Gap
Immigrants | South Eastern Asia
90.9
/100
|
#137
Exceptional
24.8%
Immigrants | Bosnia and Herzegovina
90.1
/100
|
#138
Exceptional
24.8%
Hispanics or Latinos
89.5
/100
|
#139
Excellent
24.9%
Immigrants | Nepal
89.3
/100
|
#140
Excellent
24.9%
Hawaiians
89.3
/100
|
#141
Excellent
24.9%
Afghans
88.1
/100
|
#142
Excellent
24.9%
Immigrants | Uganda
88.0
/100
|
#143
Excellent
24.9%
Chippewa
86.9
/100
|
#144
Excellent
25.0%
Comanche
85.2
/100
|
#145
Excellent
25.0%
South Americans
85.2
/100
|
#146
Excellent
25.0%
Malaysians
84.9
/100
|
#147
Excellent
25.0%
Iroquois
83.9
/100
|
#148
Excellent
25.1%
Immigrants | Peru
82.6
/100
|
#149
Excellent
25.1%
Immigrants | Immigrants
82.3
/100
|
#150
Excellent
25.1%
Taiwanese
81.6
/100
|
#151
Excellent
25.1%