Choctaw vs Chippewa Wage/Income Gap
COMPARE
Choctaw
Chippewa
Wage/Income Gap
Wage/Income Gap Comparison
Choctaw
Chippewa
28.1%
WAGE/INCOME GAP
0.4/ 100
METRIC RATING
288th/ 347
METRIC RANK
25.0%
WAGE/INCOME GAP
86.9/ 100
METRIC RATING
144th/ 347
METRIC RANK
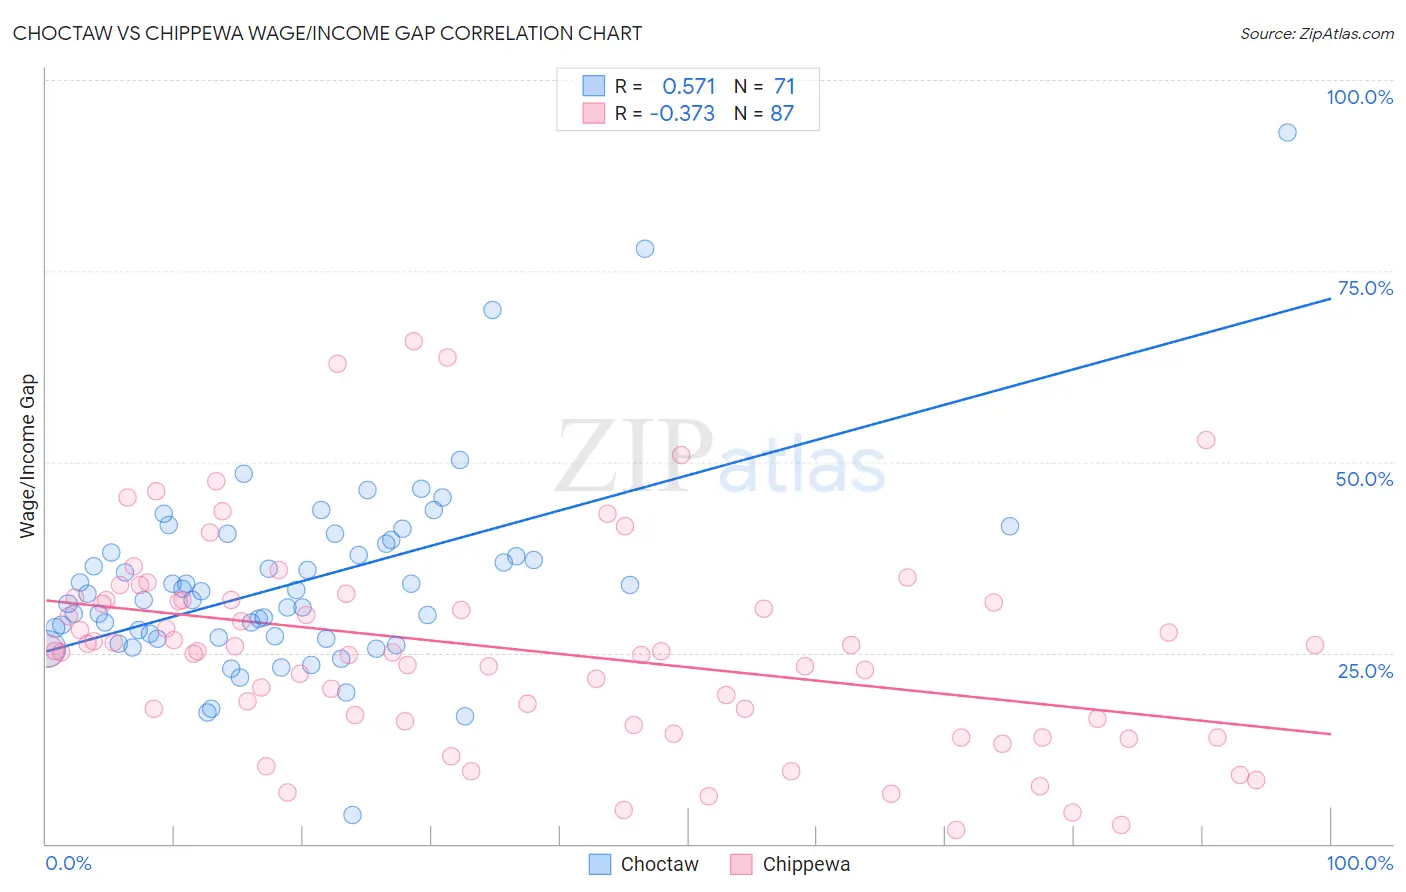
Choctaw vs Chippewa Wage/Income Gap Correlation Chart
The statistical analysis conducted on geographies consisting of 269,462,098 people shows a substantial positive correlation between the proportion of Choctaw and wage/income gap percentage in the United States with a correlation coefficient (R) of 0.571 and weighted average of 28.1%. Similarly, the statistical analysis conducted on geographies consisting of 214,916,578 people shows a mild negative correlation between the proportion of Chippewa and wage/income gap percentage in the United States with a correlation coefficient (R) of -0.373 and weighted average of 25.0%, a difference of 12.7%.
Wage/Income Gap Correlation Summary
| Measurement | Choctaw | Chippewa |
| Minimum | 3.7% | 1.9% |
| Maximum | 93.1% | 65.8% |
| Range | 89.3% | 63.9% |
| Mean | 34.2% | 25.6% |
| Median | 32.7% | 25.2% |
| Interquartile 25% (IQ1) | 26.9% | 16.0% |
| Interquartile 75% (IQ3) | 39.3% | 31.9% |
| Interquartile Range (IQR) | 12.3% | 15.9% |
| Standard Deviation (Sample) | 12.9% | 13.5% |
| Standard Deviation (Population) | 12.8% | 13.4% |
Similar Demographics by Wage/Income Gap
Demographics Similar to Choctaw by Wage/Income Gap
In terms of wage/income gap, the demographic groups most similar to Choctaw are Canadian (28.1%, a difference of 0.030%), Okinawan (28.1%, a difference of 0.040%), Immigrants from Austria (28.1%, a difference of 0.070%), Italian (28.1%, a difference of 0.10%), and Australian (28.2%, a difference of 0.13%).
| Demographics | Rating | Rank | Wage/Income Gap |
| Burmese | 0.5 /100 | #281 | Tragic 28.0% |
| South Africans | 0.5 /100 | #282 | Tragic 28.0% |
| French Canadians | 0.4 /100 | #283 | Tragic 28.1% |
| Immigrants | Sweden | 0.4 /100 | #284 | Tragic 28.1% |
| Italians | 0.4 /100 | #285 | Tragic 28.1% |
| Immigrants | Austria | 0.4 /100 | #286 | Tragic 28.1% |
| Okinawans | 0.4 /100 | #287 | Tragic 28.1% |
| Choctaw | 0.4 /100 | #288 | Tragic 28.1% |
| Canadians | 0.3 /100 | #289 | Tragic 28.1% |
| Australians | 0.3 /100 | #290 | Tragic 28.2% |
| Czechoslovakians | 0.3 /100 | #291 | Tragic 28.2% |
| Immigrants | Australia | 0.3 /100 | #292 | Tragic 28.2% |
| Immigrants | Israel | 0.3 /100 | #293 | Tragic 28.2% |
| Greeks | 0.3 /100 | #294 | Tragic 28.2% |
| Slovenes | 0.3 /100 | #295 | Tragic 28.3% |
Demographics Similar to Chippewa by Wage/Income Gap
In terms of wage/income gap, the demographic groups most similar to Chippewa are Immigrants from Uganda (24.9%, a difference of 0.18%), Afghan (24.9%, a difference of 0.19%), Comanche (25.0%, a difference of 0.24%), South American (25.0%, a difference of 0.24%), and Malaysian (25.0%, a difference of 0.27%).
| Demographics | Rating | Rank | Wage/Income Gap |
| Immigrants | South Eastern Asia | 90.9 /100 | #137 | Exceptional 24.8% |
| Immigrants | Bosnia and Herzegovina | 90.1 /100 | #138 | Exceptional 24.8% |
| Hispanics or Latinos | 89.5 /100 | #139 | Excellent 24.9% |
| Immigrants | Nepal | 89.3 /100 | #140 | Excellent 24.9% |
| Hawaiians | 89.3 /100 | #141 | Excellent 24.9% |
| Afghans | 88.1 /100 | #142 | Excellent 24.9% |
| Immigrants | Uganda | 88.0 /100 | #143 | Excellent 24.9% |
| Chippewa | 86.9 /100 | #144 | Excellent 25.0% |
| Comanche | 85.2 /100 | #145 | Excellent 25.0% |
| South Americans | 85.2 /100 | #146 | Excellent 25.0% |
| Malaysians | 84.9 /100 | #147 | Excellent 25.0% |
| Iroquois | 83.9 /100 | #148 | Excellent 25.1% |
| Immigrants | Peru | 82.6 /100 | #149 | Excellent 25.1% |
| Immigrants | Immigrants | 82.3 /100 | #150 | Excellent 25.1% |
| Taiwanese | 81.6 /100 | #151 | Excellent 25.1% |