Marshallese vs European Wage/Income Gap
COMPARE
Marshallese
European
Wage/Income Gap
Wage/Income Gap Comparison
Marshallese
Europeans
23.4%
WAGE/INCOME GAP
99.6/ 100
METRIC RATING
89th/ 347
METRIC RANK
29.4%
WAGE/INCOME GAP
0.0/ 100
METRIC RATING
333rd/ 347
METRIC RANK
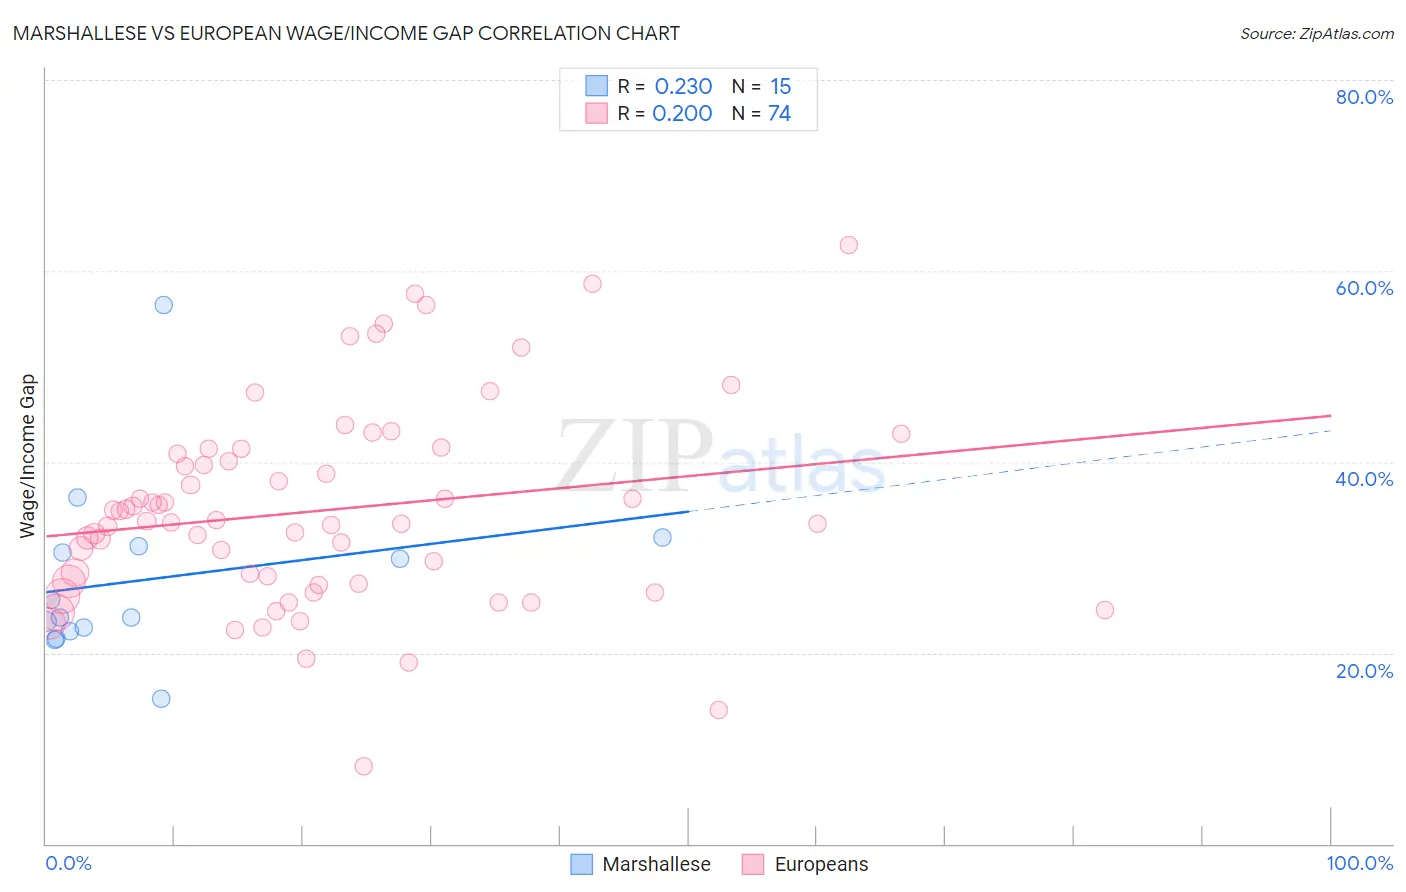
Marshallese vs European Wage/Income Gap Correlation Chart
The statistical analysis conducted on geographies consisting of 14,760,329 people shows a weak positive correlation between the proportion of Marshallese and wage/income gap percentage in the United States with a correlation coefficient (R) of 0.230 and weighted average of 23.4%. Similarly, the statistical analysis conducted on geographies consisting of 559,619,805 people shows a weak positive correlation between the proportion of Europeans and wage/income gap percentage in the United States with a correlation coefficient (R) of 0.200 and weighted average of 29.4%, a difference of 25.4%.
Wage/Income Gap Correlation Summary
| Measurement | Marshallese | European |
| Minimum | 15.1% | 8.1% |
| Maximum | 56.5% | 62.8% |
| Range | 41.4% | 54.6% |
| Mean | 27.7% | 34.9% |
| Median | 23.7% | 33.8% |
| Interquartile 25% (IQ1) | 22.2% | 27.2% |
| Interquartile 75% (IQ3) | 31.2% | 40.8% |
| Interquartile Range (IQR) | 8.9% | 13.6% |
| Standard Deviation (Sample) | 9.6% | 10.6% |
| Standard Deviation (Population) | 9.3% | 10.5% |
Similar Demographics by Wage/Income Gap
Demographics Similar to Marshallese by Wage/Income Gap
In terms of wage/income gap, the demographic groups most similar to Marshallese are Nicaraguan (23.4%, a difference of 0.010%), Immigrants from Panama (23.4%, a difference of 0.090%), Arapaho (23.5%, a difference of 0.15%), Immigrants from Honduras (23.5%, a difference of 0.30%), and Yuman (23.3%, a difference of 0.41%).
| Demographics | Rating | Rank | Wage/Income Gap |
| Central Americans | 99.8 /100 | #82 | Exceptional 23.1% |
| Immigrants | Africa | 99.8 /100 | #83 | Exceptional 23.2% |
| Cubans | 99.7 /100 | #84 | Exceptional 23.3% |
| Immigrants | Cambodia | 99.7 /100 | #85 | Exceptional 23.3% |
| Cheyenne | 99.7 /100 | #86 | Exceptional 23.3% |
| Yuman | 99.7 /100 | #87 | Exceptional 23.3% |
| Immigrants | Panama | 99.6 /100 | #88 | Exceptional 23.4% |
| Marshallese | 99.6 /100 | #89 | Exceptional 23.4% |
| Nicaraguans | 99.6 /100 | #90 | Exceptional 23.4% |
| Arapaho | 99.6 /100 | #91 | Exceptional 23.5% |
| Immigrants | Honduras | 99.5 /100 | #92 | Exceptional 23.5% |
| Immigrants | Cabo Verde | 99.5 /100 | #93 | Exceptional 23.6% |
| Hondurans | 99.5 /100 | #94 | Exceptional 23.6% |
| Cape Verdeans | 99.4 /100 | #95 | Exceptional 23.6% |
| Kiowa | 99.4 /100 | #96 | Exceptional 23.6% |
Demographics Similar to Europeans by Wage/Income Gap
In terms of wage/income gap, the demographic groups most similar to Europeans are Swedish (29.4%, a difference of 0.14%), Immigrants from South Central Asia (29.3%, a difference of 0.19%), Immigrants from Taiwan (29.5%, a difference of 0.27%), English (29.5%, a difference of 0.28%), and Czech (29.2%, a difference of 0.70%).
| Demographics | Rating | Rank | Wage/Income Gap |
| Immigrants | Belgium | 0.0 /100 | #326 | Tragic 29.0% |
| Immigrants | Iran | 0.0 /100 | #327 | Tragic 29.1% |
| Scandinavians | 0.0 /100 | #328 | Tragic 29.1% |
| Scottish | 0.0 /100 | #329 | Tragic 29.1% |
| Germans | 0.0 /100 | #330 | Tragic 29.2% |
| Czechs | 0.0 /100 | #331 | Tragic 29.2% |
| Immigrants | South Central Asia | 0.0 /100 | #332 | Tragic 29.3% |
| Europeans | 0.0 /100 | #333 | Tragic 29.4% |
| Swedes | 0.0 /100 | #334 | Tragic 29.4% |
| Immigrants | Taiwan | 0.0 /100 | #335 | Tragic 29.5% |
| English | 0.0 /100 | #336 | Tragic 29.5% |
| Dutch | 0.0 /100 | #337 | Tragic 29.6% |
| Filipinos | 0.0 /100 | #338 | Tragic 29.7% |
| Iranians | 0.0 /100 | #339 | Tragic 29.7% |
| Swiss | 0.0 /100 | #340 | Tragic 30.0% |