Immigrants from Germany vs Comanche Wage/Income Gap
COMPARE
Immigrants from Germany
Comanche
Wage/Income Gap
Wage/Income Gap Comparison
Immigrants from Germany
Comanche
27.5%
WAGE/INCOME GAP
1.5/ 100
METRIC RATING
261st/ 347
METRIC RANK
25.0%
WAGE/INCOME GAP
85.2/ 100
METRIC RATING
145th/ 347
METRIC RANK
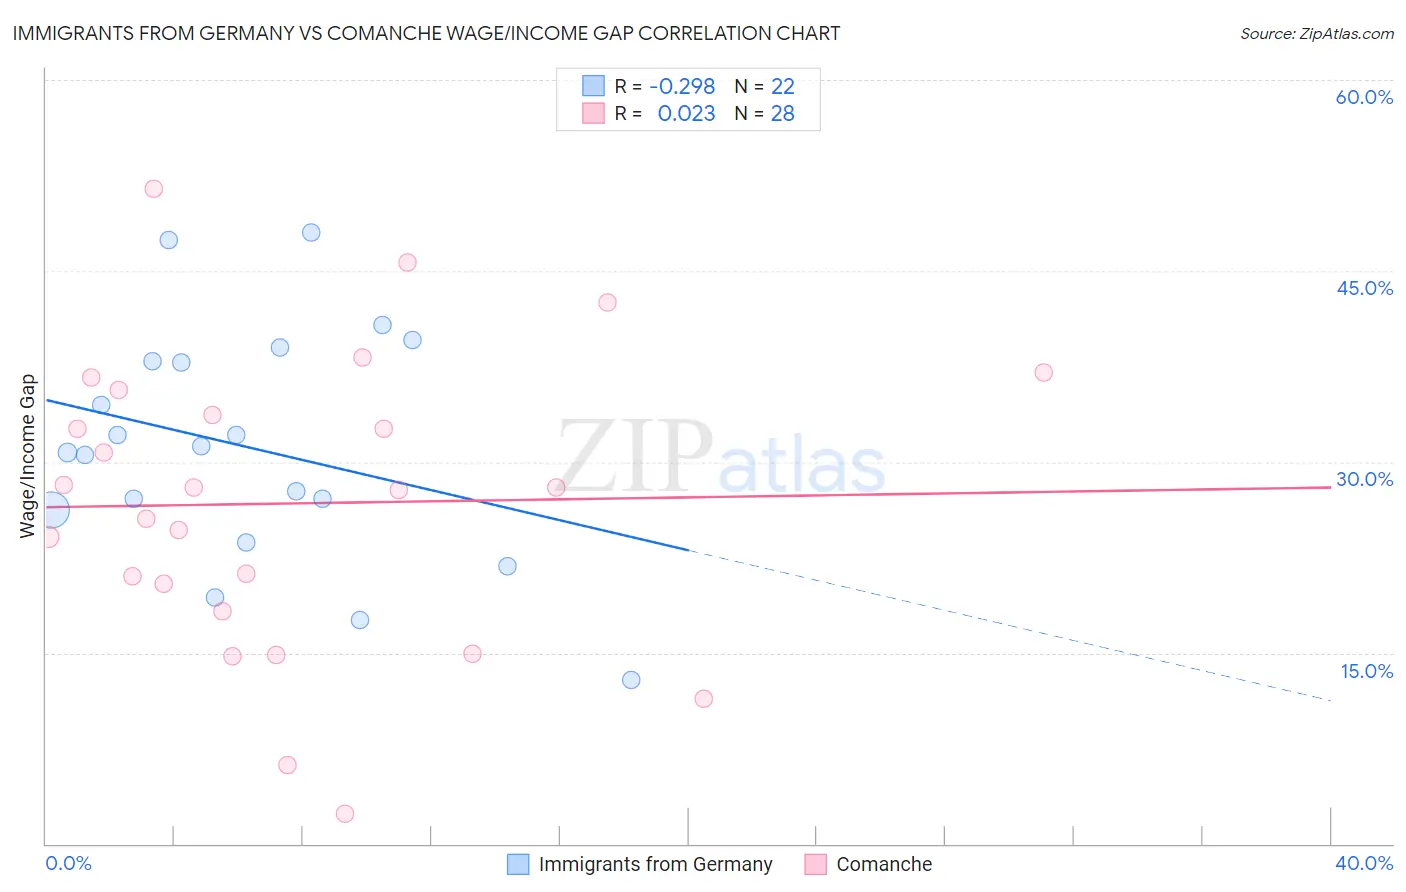
Immigrants from Germany vs Comanche Wage/Income Gap Correlation Chart
The statistical analysis conducted on geographies consisting of 463,246,314 people shows a weak negative correlation between the proportion of Immigrants from Germany and wage/income gap percentage in the United States with a correlation coefficient (R) of -0.298 and weighted average of 27.5%. Similarly, the statistical analysis conducted on geographies consisting of 109,744,354 people shows no correlation between the proportion of Comanche and wage/income gap percentage in the United States with a correlation coefficient (R) of 0.023 and weighted average of 25.0%, a difference of 10.0%.
Wage/Income Gap Correlation Summary
| Measurement | Immigrants from Germany | Comanche |
| Minimum | 12.9% | 2.4% |
| Maximum | 48.0% | 51.5% |
| Range | 35.1% | 49.1% |
| Mean | 31.1% | 26.7% |
| Median | 31.0% | 27.9% |
| Interquartile 25% (IQ1) | 26.3% | 19.4% |
| Interquartile 75% (IQ3) | 37.9% | 34.7% |
| Interquartile Range (IQR) | 11.6% | 15.3% |
| Standard Deviation (Sample) | 9.1% | 11.6% |
| Standard Deviation (Population) | 8.9% | 11.4% |
Similar Demographics by Wage/Income Gap
Demographics Similar to Immigrants from Germany by Wage/Income Gap
In terms of wage/income gap, the demographic groups most similar to Immigrants from Germany are Immigrants from Lebanon (27.5%, a difference of 0.010%), Syrian (27.6%, a difference of 0.10%), Tongan (27.5%, a difference of 0.26%), Icelander (27.5%, a difference of 0.28%), and Slavic (27.4%, a difference of 0.36%).
| Demographics | Rating | Rank | Wage/Income Gap |
| Israelis | 2.1 /100 | #254 | Tragic 27.4% |
| Immigrants | France | 2.1 /100 | #255 | Tragic 27.4% |
| Cherokee | 1.9 /100 | #256 | Tragic 27.4% |
| Luxembourgers | 1.9 /100 | #257 | Tragic 27.4% |
| Slavs | 1.8 /100 | #258 | Tragic 27.4% |
| Icelanders | 1.8 /100 | #259 | Tragic 27.5% |
| Tongans | 1.7 /100 | #260 | Tragic 27.5% |
| Immigrants | Germany | 1.5 /100 | #261 | Tragic 27.5% |
| Immigrants | Lebanon | 1.5 /100 | #262 | Tragic 27.5% |
| Syrians | 1.4 /100 | #263 | Tragic 27.6% |
| Immigrants | Switzerland | 1.0 /100 | #264 | Tragic 27.7% |
| Serbians | 1.0 /100 | #265 | Tragic 27.7% |
| Hmong | 1.0 /100 | #266 | Tragic 27.7% |
| Turks | 1.0 /100 | #267 | Tragic 27.7% |
| New Zealanders | 1.0 /100 | #268 | Tragic 27.7% |
Demographics Similar to Comanche by Wage/Income Gap
In terms of wage/income gap, the demographic groups most similar to Comanche are South American (25.0%, a difference of 0.0%), Malaysian (25.0%, a difference of 0.030%), Iroquois (25.1%, a difference of 0.16%), Chippewa (25.0%, a difference of 0.24%), and Immigrants from Peru (25.1%, a difference of 0.31%).
| Demographics | Rating | Rank | Wage/Income Gap |
| Immigrants | Bosnia and Herzegovina | 90.1 /100 | #138 | Exceptional 24.8% |
| Hispanics or Latinos | 89.5 /100 | #139 | Excellent 24.9% |
| Immigrants | Nepal | 89.3 /100 | #140 | Excellent 24.9% |
| Hawaiians | 89.3 /100 | #141 | Excellent 24.9% |
| Afghans | 88.1 /100 | #142 | Excellent 24.9% |
| Immigrants | Uganda | 88.0 /100 | #143 | Excellent 24.9% |
| Chippewa | 86.9 /100 | #144 | Excellent 25.0% |
| Comanche | 85.2 /100 | #145 | Excellent 25.0% |
| South Americans | 85.2 /100 | #146 | Excellent 25.0% |
| Malaysians | 84.9 /100 | #147 | Excellent 25.0% |
| Iroquois | 83.9 /100 | #148 | Excellent 25.1% |
| Immigrants | Peru | 82.6 /100 | #149 | Excellent 25.1% |
| Immigrants | Immigrants | 82.3 /100 | #150 | Excellent 25.1% |
| Taiwanese | 81.6 /100 | #151 | Excellent 25.1% |
| Uruguayans | 81.3 /100 | #152 | Excellent 25.2% |