Guamanian/Chamorro vs Pima Householder Income Over 65 years
COMPARE
Guamanian/Chamorro
Pima
Householder Income Over 65 years
Householder Income Over 65 years Comparison
Guamanians/Chamorros
Pima
$63,187
HOUSEHOLDER INCOME OVER 65 YEARS
91.1/ 100
METRIC RATING
116th/ 347
METRIC RANK
$50,539
HOUSEHOLDER INCOME OVER 65 YEARS
0.0/ 100
METRIC RATING
331st/ 347
METRIC RANK
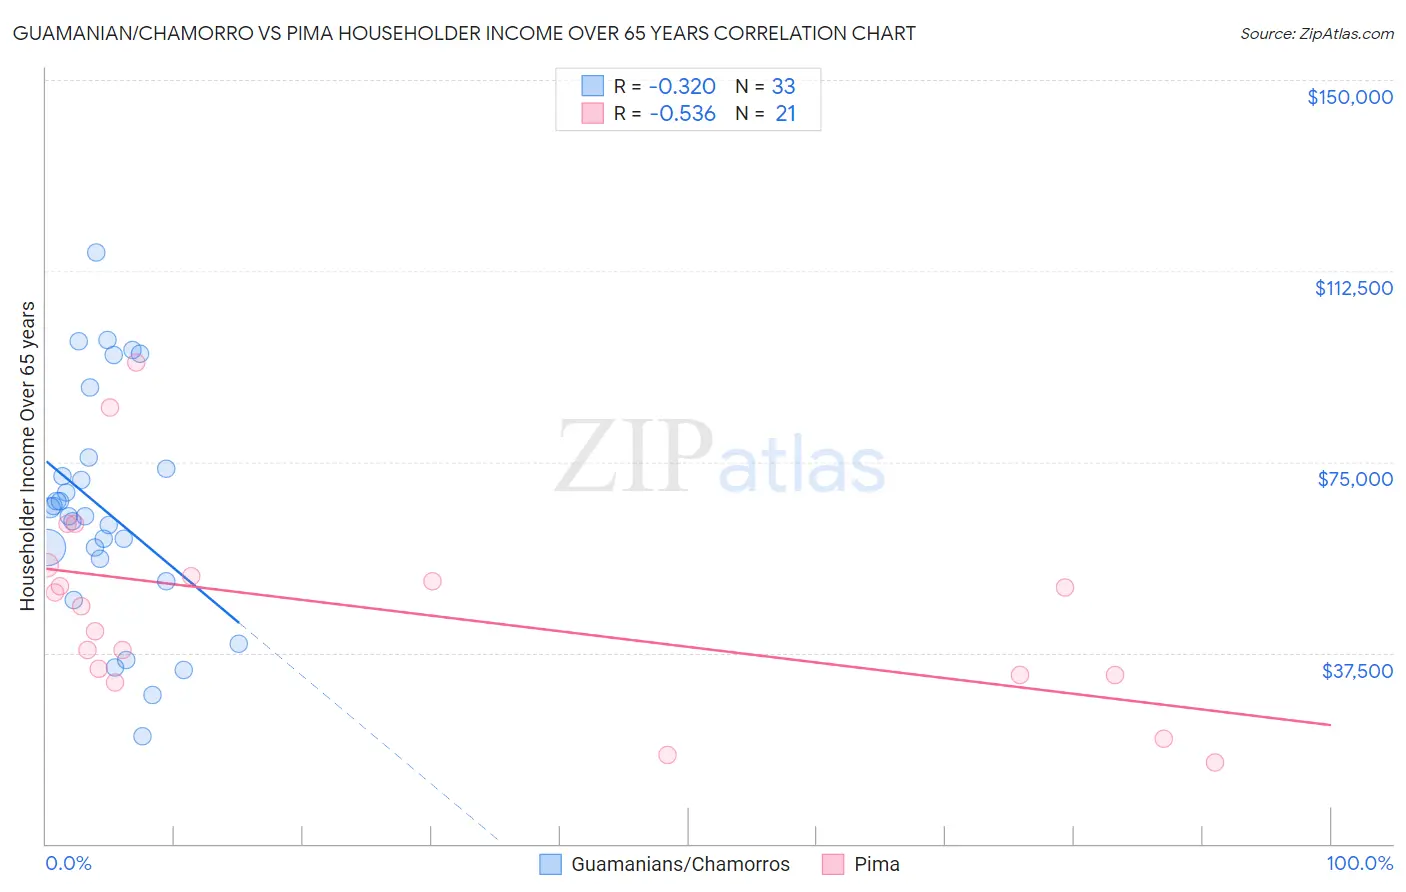
Guamanian/Chamorro vs Pima Householder Income Over 65 years Correlation Chart
The statistical analysis conducted on geographies consisting of 221,091,968 people shows a mild negative correlation between the proportion of Guamanians/Chamorros and household income with householder over the age of 65 in the United States with a correlation coefficient (R) of -0.320 and weighted average of $63,187. Similarly, the statistical analysis conducted on geographies consisting of 61,493,441 people shows a substantial negative correlation between the proportion of Pima and household income with householder over the age of 65 in the United States with a correlation coefficient (R) of -0.536 and weighted average of $50,539, a difference of 25.0%.
Householder Income Over 65 years Correlation Summary
| Measurement | Guamanian/Chamorro | Pima |
| Minimum | $21,071 | $15,972 |
| Maximum | $116,094 | $94,583 |
| Range | $95,023 | $78,611 |
| Mean | $65,533 | $45,976 |
| Median | $64,389 | $46,564 |
| Interquartile 25% (IQ1) | $53,785 | $33,050 |
| Interquartile 75% (IQ3) | $74,861 | $53,656 |
| Interquartile Range (IQR) | $21,076 | $20,606 |
| Standard Deviation (Sample) | $22,403 | $19,860 |
| Standard Deviation (Population) | $22,061 | $19,381 |
Similar Demographics by Householder Income Over 65 years
Demographics Similar to Guamanians/Chamorros by Householder Income Over 65 years
In terms of householder income over 65 years, the demographic groups most similar to Guamanians/Chamorros are Immigrants from Croatia ($63,168, a difference of 0.030%), Croatian ($63,225, a difference of 0.060%), Danish ($63,117, a difference of 0.11%), Immigrants from Jordan ($63,041, a difference of 0.23%), and Ukrainian ($63,032, a difference of 0.25%).
| Demographics | Rating | Rank | Householder Income Over 65 years |
| Europeans | 95.0 /100 | #109 | Exceptional $63,779 |
| Immigrants | Zimbabwe | 94.3 /100 | #110 | Exceptional $63,643 |
| Immigrants | Spain | 93.7 /100 | #111 | Exceptional $63,540 |
| Syrians | 93.4 /100 | #112 | Exceptional $63,494 |
| Immigrants | Serbia | 92.7 /100 | #113 | Exceptional $63,387 |
| Immigrants | Saudi Arabia | 92.4 /100 | #114 | Exceptional $63,355 |
| Croatians | 91.4 /100 | #115 | Exceptional $63,225 |
| Guamanians/Chamorros | 91.1 /100 | #116 | Exceptional $63,187 |
| Immigrants | Croatia | 90.9 /100 | #117 | Exceptional $63,168 |
| Danes | 90.5 /100 | #118 | Exceptional $63,117 |
| Immigrants | Jordan | 89.8 /100 | #119 | Excellent $63,041 |
| Ukrainians | 89.7 /100 | #120 | Excellent $63,032 |
| Immigrants | Vietnam | 89.5 /100 | #121 | Excellent $63,014 |
| Immigrants | Moldova | 88.7 /100 | #122 | Excellent $62,939 |
| Tlingit-Haida | 88.6 /100 | #123 | Excellent $62,922 |
Demographics Similar to Pima by Householder Income Over 65 years
In terms of householder income over 65 years, the demographic groups most similar to Pima are Dutch West Indian ($50,475, a difference of 0.13%), Immigrants from Grenada ($50,747, a difference of 0.41%), Black/African American ($50,779, a difference of 0.47%), Hopi ($50,925, a difference of 0.76%), and Bahamian ($51,000, a difference of 0.91%).
| Demographics | Rating | Rank | Householder Income Over 65 years |
| Immigrants | Congo | 0.0 /100 | #324 | Tragic $51,393 |
| Immigrants | Haiti | 0.0 /100 | #325 | Tragic $51,219 |
| Kiowa | 0.0 /100 | #326 | Tragic $51,140 |
| Bahamians | 0.0 /100 | #327 | Tragic $51,000 |
| Hopi | 0.0 /100 | #328 | Tragic $50,925 |
| Blacks/African Americans | 0.0 /100 | #329 | Tragic $50,779 |
| Immigrants | Grenada | 0.0 /100 | #330 | Tragic $50,747 |
| Pima | 0.0 /100 | #331 | Tragic $50,539 |
| Dutch West Indians | 0.0 /100 | #332 | Tragic $50,475 |
| Cape Verdeans | 0.0 /100 | #333 | Tragic $50,077 |
| Immigrants | Dominica | 0.0 /100 | #334 | Tragic $50,071 |
| Crow | 0.0 /100 | #335 | Tragic $49,234 |
| Cubans | 0.0 /100 | #336 | Tragic $49,152 |
| Tohono O'odham | 0.0 /100 | #337 | Tragic $49,121 |
| Immigrants | Caribbean | 0.0 /100 | #338 | Tragic $48,535 |