Guamanian/Chamorro vs Bulgarian Householder Income Over 65 years
COMPARE
Guamanian/Chamorro
Bulgarian
Householder Income Over 65 years
Householder Income Over 65 years Comparison
Guamanians/Chamorros
Bulgarians
$63,187
HOUSEHOLDER INCOME OVER 65 YEARS
91.1/ 100
METRIC RATING
116th/ 347
METRIC RANK
$66,236
HOUSEHOLDER INCOME OVER 65 YEARS
99.6/ 100
METRIC RATING
57th/ 347
METRIC RANK
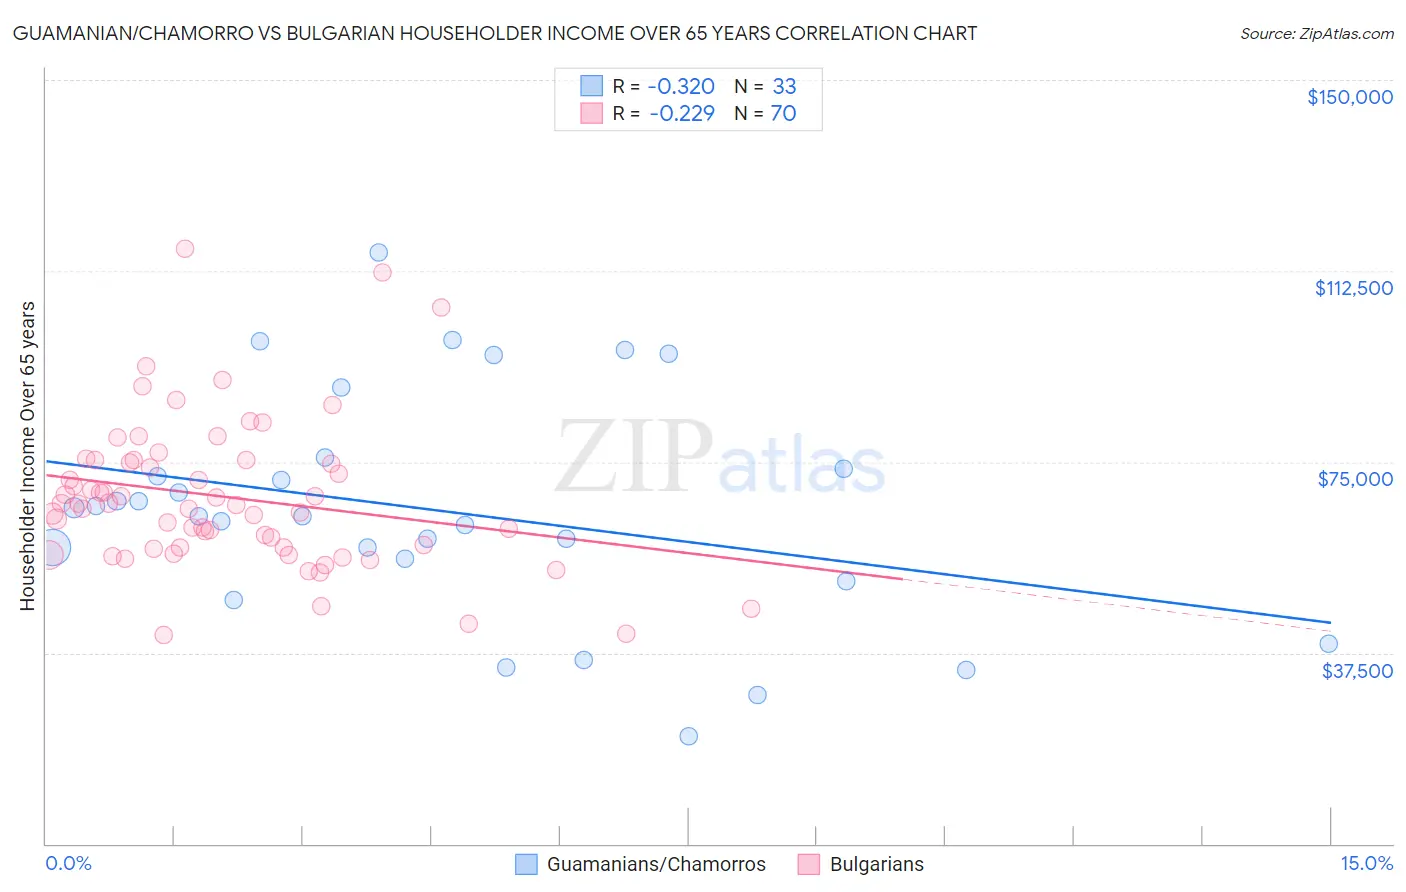
Guamanian/Chamorro vs Bulgarian Householder Income Over 65 years Correlation Chart
The statistical analysis conducted on geographies consisting of 221,091,968 people shows a mild negative correlation between the proportion of Guamanians/Chamorros and household income with householder over the age of 65 in the United States with a correlation coefficient (R) of -0.320 and weighted average of $63,187. Similarly, the statistical analysis conducted on geographies consisting of 205,399,104 people shows a weak negative correlation between the proportion of Bulgarians and household income with householder over the age of 65 in the United States with a correlation coefficient (R) of -0.229 and weighted average of $66,236, a difference of 4.8%.
Householder Income Over 65 years Correlation Summary
| Measurement | Guamanian/Chamorro | Bulgarian |
| Minimum | $21,071 | $40,918 |
| Maximum | $116,094 | $116,874 |
| Range | $95,023 | $75,956 |
| Mean | $65,533 | $68,096 |
| Median | $64,389 | $66,678 |
| Interquartile 25% (IQ1) | $53,785 | $58,125 |
| Interquartile 75% (IQ3) | $74,861 | $75,296 |
| Interquartile Range (IQR) | $21,076 | $17,171 |
| Standard Deviation (Sample) | $22,403 | $14,736 |
| Standard Deviation (Population) | $22,061 | $14,630 |
Similar Demographics by Householder Income Over 65 years
Demographics Similar to Guamanians/Chamorros by Householder Income Over 65 years
In terms of householder income over 65 years, the demographic groups most similar to Guamanians/Chamorros are Immigrants from Croatia ($63,168, a difference of 0.030%), Croatian ($63,225, a difference of 0.060%), Danish ($63,117, a difference of 0.11%), Immigrants from Jordan ($63,041, a difference of 0.23%), and Ukrainian ($63,032, a difference of 0.25%).
| Demographics | Rating | Rank | Householder Income Over 65 years |
| Europeans | 95.0 /100 | #109 | Exceptional $63,779 |
| Immigrants | Zimbabwe | 94.3 /100 | #110 | Exceptional $63,643 |
| Immigrants | Spain | 93.7 /100 | #111 | Exceptional $63,540 |
| Syrians | 93.4 /100 | #112 | Exceptional $63,494 |
| Immigrants | Serbia | 92.7 /100 | #113 | Exceptional $63,387 |
| Immigrants | Saudi Arabia | 92.4 /100 | #114 | Exceptional $63,355 |
| Croatians | 91.4 /100 | #115 | Exceptional $63,225 |
| Guamanians/Chamorros | 91.1 /100 | #116 | Exceptional $63,187 |
| Immigrants | Croatia | 90.9 /100 | #117 | Exceptional $63,168 |
| Danes | 90.5 /100 | #118 | Exceptional $63,117 |
| Immigrants | Jordan | 89.8 /100 | #119 | Excellent $63,041 |
| Ukrainians | 89.7 /100 | #120 | Excellent $63,032 |
| Immigrants | Vietnam | 89.5 /100 | #121 | Excellent $63,014 |
| Immigrants | Moldova | 88.7 /100 | #122 | Excellent $62,939 |
| Tlingit-Haida | 88.6 /100 | #123 | Excellent $62,922 |
Demographics Similar to Bulgarians by Householder Income Over 65 years
In terms of householder income over 65 years, the demographic groups most similar to Bulgarians are Laotian ($66,306, a difference of 0.11%), Immigrants from Philippines ($66,161, a difference of 0.11%), Immigrants from Norway ($66,118, a difference of 0.18%), Immigrants from Czechoslovakia ($66,376, a difference of 0.21%), and Immigrants from Lithuania ($66,087, a difference of 0.22%).
| Demographics | Rating | Rank | Householder Income Over 65 years |
| Immigrants | Turkey | 99.7 /100 | #50 | Exceptional $66,672 |
| Israelis | 99.7 /100 | #51 | Exceptional $66,636 |
| Immigrants | Scotland | 99.7 /100 | #52 | Exceptional $66,620 |
| Immigrants | Pakistan | 99.7 /100 | #53 | Exceptional $66,617 |
| Immigrants | Netherlands | 99.7 /100 | #54 | Exceptional $66,463 |
| Immigrants | Czechoslovakia | 99.7 /100 | #55 | Exceptional $66,376 |
| Laotians | 99.6 /100 | #56 | Exceptional $66,306 |
| Bulgarians | 99.6 /100 | #57 | Exceptional $66,236 |
| Immigrants | Philippines | 99.6 /100 | #58 | Exceptional $66,161 |
| Immigrants | Norway | 99.5 /100 | #59 | Exceptional $66,118 |
| Immigrants | Lithuania | 99.5 /100 | #60 | Exceptional $66,087 |
| Maltese | 99.5 /100 | #61 | Exceptional $66,027 |
| Immigrants | Sierra Leone | 99.5 /100 | #62 | Exceptional $66,009 |
| Marshallese | 99.4 /100 | #63 | Exceptional $65,874 |
| Zimbabweans | 99.4 /100 | #64 | Exceptional $65,854 |