Guamanian/Chamorro vs Bhutanese Householder Income Over 65 years
COMPARE
Guamanian/Chamorro
Bhutanese
Householder Income Over 65 years
Householder Income Over 65 years Comparison
Guamanians/Chamorros
Bhutanese
$63,187
HOUSEHOLDER INCOME OVER 65 YEARS
91.1/ 100
METRIC RATING
116th/ 347
METRIC RANK
$72,288
HOUSEHOLDER INCOME OVER 65 YEARS
100.0/ 100
METRIC RATING
10th/ 347
METRIC RANK
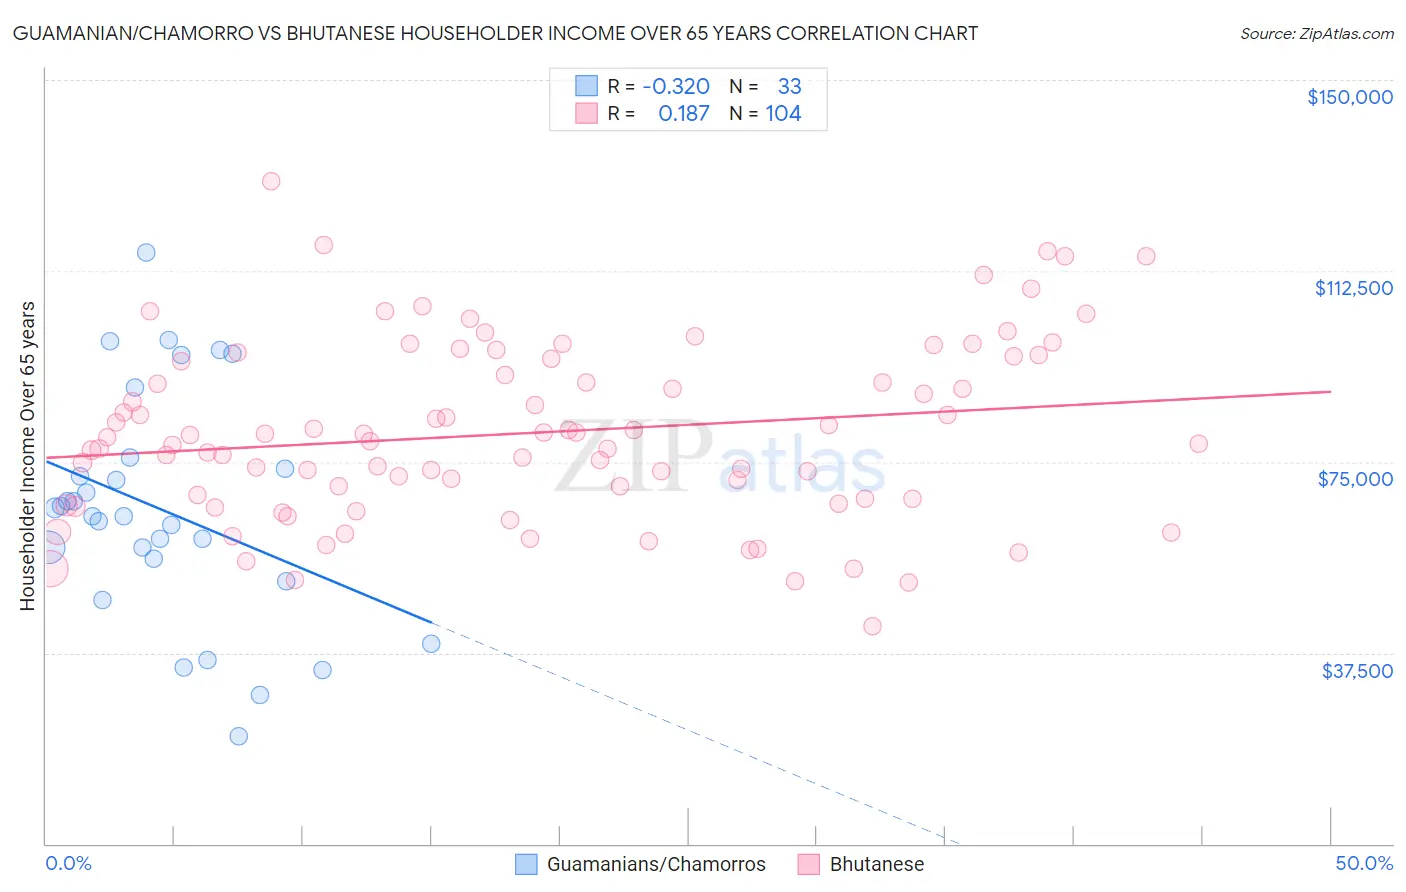
Guamanian/Chamorro vs Bhutanese Householder Income Over 65 years Correlation Chart
The statistical analysis conducted on geographies consisting of 221,091,968 people shows a mild negative correlation between the proportion of Guamanians/Chamorros and household income with householder over the age of 65 in the United States with a correlation coefficient (R) of -0.320 and weighted average of $63,187. Similarly, the statistical analysis conducted on geographies consisting of 453,217,193 people shows a poor positive correlation between the proportion of Bhutanese and household income with householder over the age of 65 in the United States with a correlation coefficient (R) of 0.187 and weighted average of $72,288, a difference of 14.4%.
Householder Income Over 65 years Correlation Summary
| Measurement | Guamanian/Chamorro | Bhutanese |
| Minimum | $21,071 | $42,695 |
| Maximum | $116,094 | $130,207 |
| Range | $95,023 | $87,512 |
| Mean | $65,533 | $80,718 |
| Median | $64,389 | $79,378 |
| Interquartile 25% (IQ1) | $53,785 | $67,810 |
| Interquartile 75% (IQ3) | $74,861 | $95,004 |
| Interquartile Range (IQR) | $21,076 | $27,195 |
| Standard Deviation (Sample) | $22,403 | $17,380 |
| Standard Deviation (Population) | $22,061 | $17,296 |
Similar Demographics by Householder Income Over 65 years
Demographics Similar to Guamanians/Chamorros by Householder Income Over 65 years
In terms of householder income over 65 years, the demographic groups most similar to Guamanians/Chamorros are Immigrants from Croatia ($63,168, a difference of 0.030%), Croatian ($63,225, a difference of 0.060%), Danish ($63,117, a difference of 0.11%), Immigrants from Jordan ($63,041, a difference of 0.23%), and Ukrainian ($63,032, a difference of 0.25%).
| Demographics | Rating | Rank | Householder Income Over 65 years |
| Europeans | 95.0 /100 | #109 | Exceptional $63,779 |
| Immigrants | Zimbabwe | 94.3 /100 | #110 | Exceptional $63,643 |
| Immigrants | Spain | 93.7 /100 | #111 | Exceptional $63,540 |
| Syrians | 93.4 /100 | #112 | Exceptional $63,494 |
| Immigrants | Serbia | 92.7 /100 | #113 | Exceptional $63,387 |
| Immigrants | Saudi Arabia | 92.4 /100 | #114 | Exceptional $63,355 |
| Croatians | 91.4 /100 | #115 | Exceptional $63,225 |
| Guamanians/Chamorros | 91.1 /100 | #116 | Exceptional $63,187 |
| Immigrants | Croatia | 90.9 /100 | #117 | Exceptional $63,168 |
| Danes | 90.5 /100 | #118 | Exceptional $63,117 |
| Immigrants | Jordan | 89.8 /100 | #119 | Excellent $63,041 |
| Ukrainians | 89.7 /100 | #120 | Excellent $63,032 |
| Immigrants | Vietnam | 89.5 /100 | #121 | Excellent $63,014 |
| Immigrants | Moldova | 88.7 /100 | #122 | Excellent $62,939 |
| Tlingit-Haida | 88.6 /100 | #123 | Excellent $62,922 |
Demographics Similar to Bhutanese by Householder Income Over 65 years
In terms of householder income over 65 years, the demographic groups most similar to Bhutanese are Thai ($72,099, a difference of 0.26%), Immigrants from India ($72,804, a difference of 0.71%), Cypriot ($71,714, a difference of 0.80%), Immigrants from Singapore ($72,963, a difference of 0.93%), and Immigrants from Hong Kong ($71,567, a difference of 1.0%).
| Demographics | Rating | Rank | Householder Income Over 65 years |
| Immigrants | Taiwan | 100.0 /100 | #3 | Exceptional $77,051 |
| Filipinos | 100.0 /100 | #4 | Exceptional $76,686 |
| Immigrants | Iran | 100.0 /100 | #5 | Exceptional $75,081 |
| Bolivians | 100.0 /100 | #6 | Exceptional $74,245 |
| Immigrants | Bolivia | 100.0 /100 | #7 | Exceptional $73,434 |
| Immigrants | Singapore | 100.0 /100 | #8 | Exceptional $72,963 |
| Immigrants | India | 100.0 /100 | #9 | Exceptional $72,804 |
| Bhutanese | 100.0 /100 | #10 | Exceptional $72,288 |
| Thais | 100.0 /100 | #11 | Exceptional $72,099 |
| Cypriots | 100.0 /100 | #12 | Exceptional $71,714 |
| Immigrants | Hong Kong | 100.0 /100 | #13 | Exceptional $71,567 |
| Burmese | 100.0 /100 | #14 | Exceptional $71,139 |
| Native Hawaiians | 100.0 /100 | #15 | Exceptional $71,021 |
| Okinawans | 100.0 /100 | #16 | Exceptional $70,846 |
| Immigrants | Korea | 100.0 /100 | #17 | Exceptional $70,696 |