Guamanian/Chamorro vs Nonimmigrants Householder Income Over 65 years
COMPARE
Guamanian/Chamorro
Nonimmigrants
Householder Income Over 65 years
Householder Income Over 65 years Comparison
Guamanians/Chamorros
Nonimmigrants
$63,187
HOUSEHOLDER INCOME OVER 65 YEARS
91.1/ 100
METRIC RATING
116th/ 347
METRIC RANK
$57,426
HOUSEHOLDER INCOME OVER 65 YEARS
2.4/ 100
METRIC RATING
231st/ 347
METRIC RANK
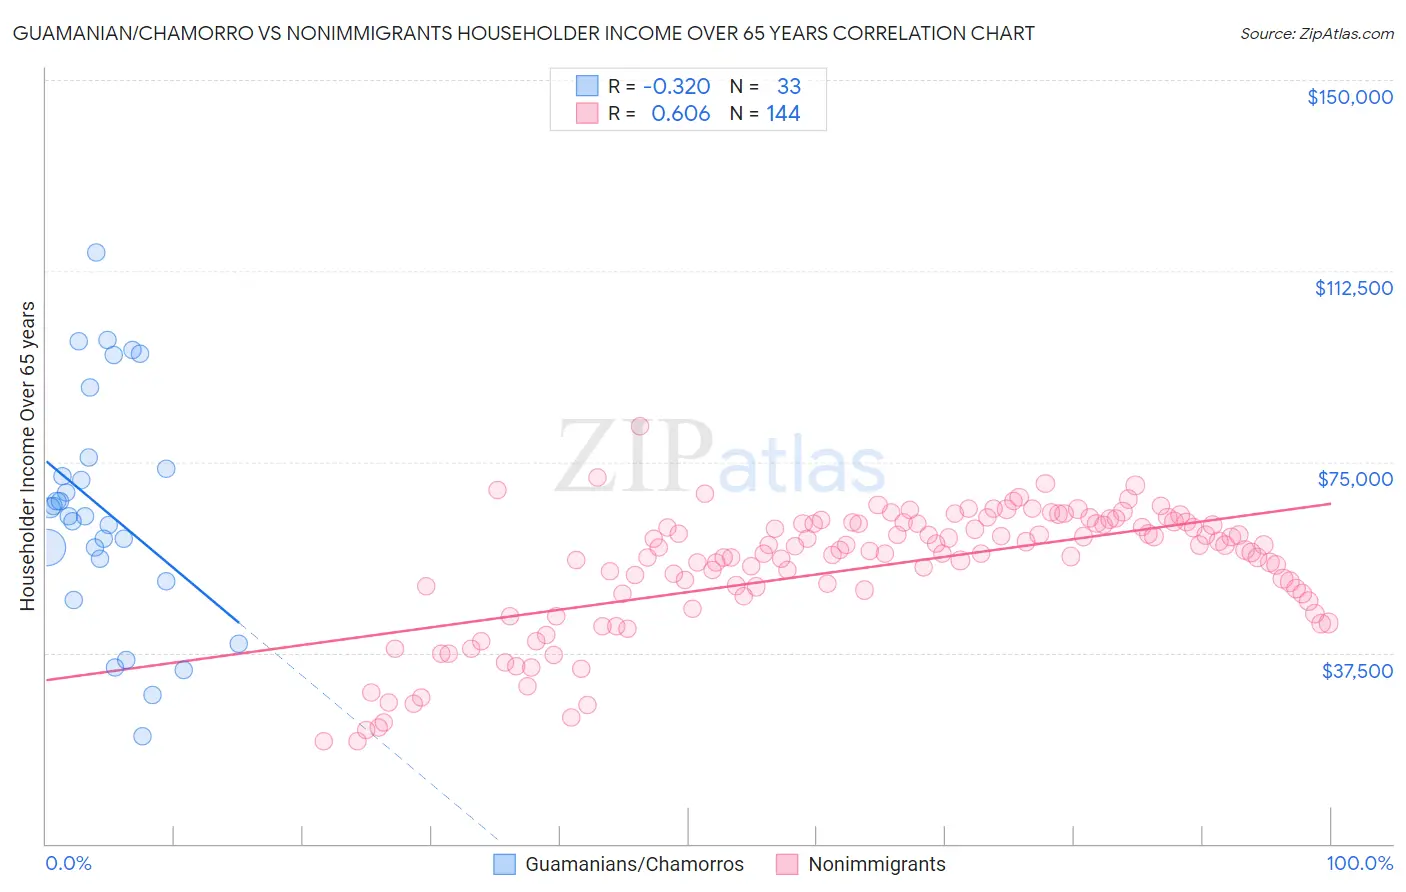
Guamanian/Chamorro vs Nonimmigrants Householder Income Over 65 years Correlation Chart
The statistical analysis conducted on geographies consisting of 221,091,968 people shows a mild negative correlation between the proportion of Guamanians/Chamorros and household income with householder over the age of 65 in the United States with a correlation coefficient (R) of -0.320 and weighted average of $63,187. Similarly, the statistical analysis conducted on geographies consisting of 577,532,180 people shows a significant positive correlation between the proportion of Nonimmigrants and household income with householder over the age of 65 in the United States with a correlation coefficient (R) of 0.606 and weighted average of $57,426, a difference of 10.0%.
Householder Income Over 65 years Correlation Summary
| Measurement | Guamanian/Chamorro | Nonimmigrants |
| Minimum | $21,071 | $20,075 |
| Maximum | $116,094 | $81,974 |
| Range | $95,023 | $61,899 |
| Mean | $65,533 | $54,158 |
| Median | $64,389 | $57,563 |
| Interquartile 25% (IQ1) | $53,785 | $49,141 |
| Interquartile 75% (IQ3) | $74,861 | $62,877 |
| Interquartile Range (IQR) | $21,076 | $13,736 |
| Standard Deviation (Sample) | $22,403 | $12,340 |
| Standard Deviation (Population) | $22,061 | $12,297 |
Similar Demographics by Householder Income Over 65 years
Demographics Similar to Guamanians/Chamorros by Householder Income Over 65 years
In terms of householder income over 65 years, the demographic groups most similar to Guamanians/Chamorros are Immigrants from Croatia ($63,168, a difference of 0.030%), Croatian ($63,225, a difference of 0.060%), Danish ($63,117, a difference of 0.11%), Immigrants from Jordan ($63,041, a difference of 0.23%), and Ukrainian ($63,032, a difference of 0.25%).
| Demographics | Rating | Rank | Householder Income Over 65 years |
| Europeans | 95.0 /100 | #109 | Exceptional $63,779 |
| Immigrants | Zimbabwe | 94.3 /100 | #110 | Exceptional $63,643 |
| Immigrants | Spain | 93.7 /100 | #111 | Exceptional $63,540 |
| Syrians | 93.4 /100 | #112 | Exceptional $63,494 |
| Immigrants | Serbia | 92.7 /100 | #113 | Exceptional $63,387 |
| Immigrants | Saudi Arabia | 92.4 /100 | #114 | Exceptional $63,355 |
| Croatians | 91.4 /100 | #115 | Exceptional $63,225 |
| Guamanians/Chamorros | 91.1 /100 | #116 | Exceptional $63,187 |
| Immigrants | Croatia | 90.9 /100 | #117 | Exceptional $63,168 |
| Danes | 90.5 /100 | #118 | Exceptional $63,117 |
| Immigrants | Jordan | 89.8 /100 | #119 | Excellent $63,041 |
| Ukrainians | 89.7 /100 | #120 | Excellent $63,032 |
| Immigrants | Vietnam | 89.5 /100 | #121 | Excellent $63,014 |
| Immigrants | Moldova | 88.7 /100 | #122 | Excellent $62,939 |
| Tlingit-Haida | 88.6 /100 | #123 | Excellent $62,922 |
Demographics Similar to Nonimmigrants by Householder Income Over 65 years
In terms of householder income over 65 years, the demographic groups most similar to Nonimmigrants are Immigrants from Venezuela ($57,371, a difference of 0.090%), Immigrants from Cambodia ($57,580, a difference of 0.27%), Immigrants from Colombia ($57,658, a difference of 0.41%), Immigrants from Western Africa ($57,119, a difference of 0.54%), and Immigrants from Burma/Myanmar ($57,114, a difference of 0.55%).
| Demographics | Rating | Rank | Householder Income Over 65 years |
| Bermudans | 5.1 /100 | #224 | Tragic $58,171 |
| Venezuelans | 4.4 /100 | #225 | Tragic $58,026 |
| French Canadians | 4.2 /100 | #226 | Tragic $57,975 |
| Japanese | 3.9 /100 | #227 | Tragic $57,919 |
| Immigrants | Albania | 3.6 /100 | #228 | Tragic $57,828 |
| Immigrants | Colombia | 3.0 /100 | #229 | Tragic $57,658 |
| Immigrants | Cambodia | 2.8 /100 | #230 | Tragic $57,580 |
| Immigrants | Nonimmigrants | 2.4 /100 | #231 | Tragic $57,426 |
| Immigrants | Venezuela | 2.3 /100 | #232 | Tragic $57,371 |
| Immigrants | Western Africa | 1.7 /100 | #233 | Tragic $57,119 |
| Immigrants | Burma/Myanmar | 1.7 /100 | #234 | Tragic $57,114 |
| Spanish Americans | 1.6 /100 | #235 | Tragic $57,021 |
| Immigrants | Uruguay | 1.5 /100 | #236 | Tragic $56,975 |
| Immigrants | Panama | 1.5 /100 | #237 | Tragic $56,944 |
| Fijians | 1.2 /100 | #238 | Tragic $56,768 |