Guamanian/Chamorro vs Immigrants from South Africa Householder Income Over 65 years
COMPARE
Guamanian/Chamorro
Immigrants from South Africa
Householder Income Over 65 years
Householder Income Over 65 years Comparison
Guamanians/Chamorros
Immigrants from South Africa
$63,187
HOUSEHOLDER INCOME OVER 65 YEARS
91.1/ 100
METRIC RATING
116th/ 347
METRIC RANK
$67,234
HOUSEHOLDER INCOME OVER 65 YEARS
99.9/ 100
METRIC RATING
44th/ 347
METRIC RANK
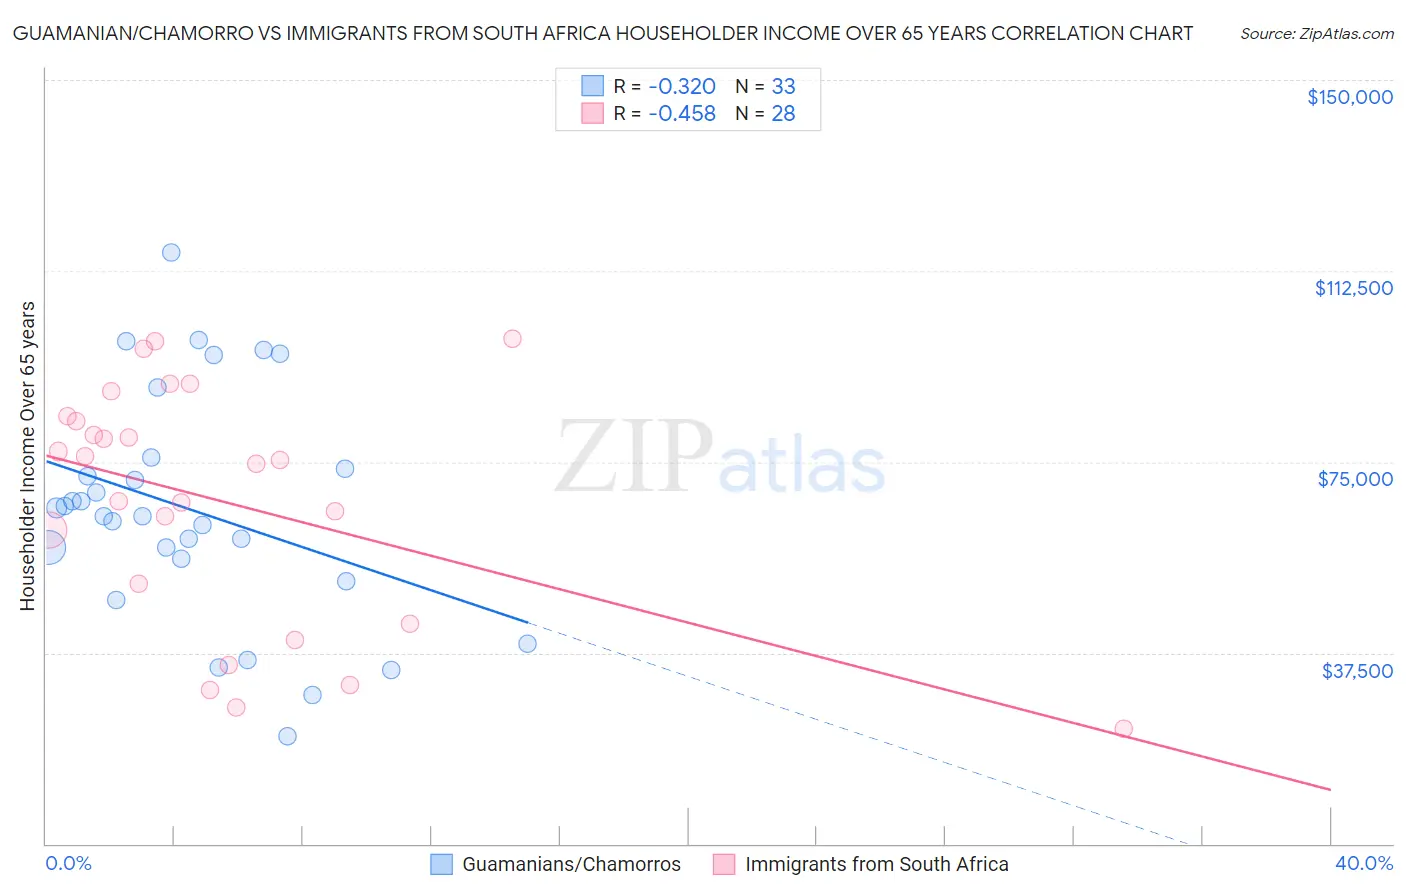
Guamanian/Chamorro vs Immigrants from South Africa Householder Income Over 65 years Correlation Chart
The statistical analysis conducted on geographies consisting of 221,091,968 people shows a mild negative correlation between the proportion of Guamanians/Chamorros and household income with householder over the age of 65 in the United States with a correlation coefficient (R) of -0.320 and weighted average of $63,187. Similarly, the statistical analysis conducted on geographies consisting of 232,954,007 people shows a moderate negative correlation between the proportion of Immigrants from South Africa and household income with householder over the age of 65 in the United States with a correlation coefficient (R) of -0.458 and weighted average of $67,234, a difference of 6.4%.
Householder Income Over 65 years Correlation Summary
| Measurement | Guamanian/Chamorro | Immigrants from South Africa |
| Minimum | $21,071 | $22,500 |
| Maximum | $116,094 | $99,125 |
| Range | $95,023 | $76,625 |
| Mean | $65,533 | $67,143 |
| Median | $64,389 | $74,972 |
| Interquartile 25% (IQ1) | $53,785 | $47,057 |
| Interquartile 75% (IQ3) | $74,861 | $83,529 |
| Interquartile Range (IQR) | $21,076 | $36,471 |
| Standard Deviation (Sample) | $22,403 | $23,355 |
| Standard Deviation (Population) | $22,061 | $22,935 |
Similar Demographics by Householder Income Over 65 years
Demographics Similar to Guamanians/Chamorros by Householder Income Over 65 years
In terms of householder income over 65 years, the demographic groups most similar to Guamanians/Chamorros are Immigrants from Croatia ($63,168, a difference of 0.030%), Croatian ($63,225, a difference of 0.060%), Danish ($63,117, a difference of 0.11%), Immigrants from Jordan ($63,041, a difference of 0.23%), and Ukrainian ($63,032, a difference of 0.25%).
| Demographics | Rating | Rank | Householder Income Over 65 years |
| Europeans | 95.0 /100 | #109 | Exceptional $63,779 |
| Immigrants | Zimbabwe | 94.3 /100 | #110 | Exceptional $63,643 |
| Immigrants | Spain | 93.7 /100 | #111 | Exceptional $63,540 |
| Syrians | 93.4 /100 | #112 | Exceptional $63,494 |
| Immigrants | Serbia | 92.7 /100 | #113 | Exceptional $63,387 |
| Immigrants | Saudi Arabia | 92.4 /100 | #114 | Exceptional $63,355 |
| Croatians | 91.4 /100 | #115 | Exceptional $63,225 |
| Guamanians/Chamorros | 91.1 /100 | #116 | Exceptional $63,187 |
| Immigrants | Croatia | 90.9 /100 | #117 | Exceptional $63,168 |
| Danes | 90.5 /100 | #118 | Exceptional $63,117 |
| Immigrants | Jordan | 89.8 /100 | #119 | Excellent $63,041 |
| Ukrainians | 89.7 /100 | #120 | Excellent $63,032 |
| Immigrants | Vietnam | 89.5 /100 | #121 | Excellent $63,014 |
| Immigrants | Moldova | 88.7 /100 | #122 | Excellent $62,939 |
| Tlingit-Haida | 88.6 /100 | #123 | Excellent $62,922 |
Demographics Similar to Immigrants from South Africa by Householder Income Over 65 years
In terms of householder income over 65 years, the demographic groups most similar to Immigrants from South Africa are Latvian ($67,326, a difference of 0.14%), New Zealander ($67,333, a difference of 0.15%), Immigrants from Afghanistan ($67,007, a difference of 0.34%), Korean ($67,472, a difference of 0.35%), and Cambodian ($66,892, a difference of 0.51%).
| Demographics | Rating | Rank | Householder Income Over 65 years |
| Turks | 99.9 /100 | #37 | Exceptional $68,037 |
| Estonians | 99.9 /100 | #38 | Exceptional $67,926 |
| Russians | 99.9 /100 | #39 | Exceptional $67,626 |
| Immigrants | Asia | 99.9 /100 | #40 | Exceptional $67,594 |
| Koreans | 99.9 /100 | #41 | Exceptional $67,472 |
| New Zealanders | 99.9 /100 | #42 | Exceptional $67,333 |
| Latvians | 99.9 /100 | #43 | Exceptional $67,326 |
| Immigrants | South Africa | 99.9 /100 | #44 | Exceptional $67,234 |
| Immigrants | Afghanistan | 99.8 /100 | #45 | Exceptional $67,007 |
| Cambodians | 99.8 /100 | #46 | Exceptional $66,892 |
| Australians | 99.8 /100 | #47 | Exceptional $66,891 |
| Immigrants | France | 99.8 /100 | #48 | Exceptional $66,826 |
| Immigrants | Indonesia | 99.8 /100 | #49 | Exceptional $66,694 |
| Immigrants | Turkey | 99.7 /100 | #50 | Exceptional $66,672 |
| Israelis | 99.7 /100 | #51 | Exceptional $66,636 |