Immigrants from Lithuania vs Pima Householder Income Over 65 years
COMPARE
Immigrants from Lithuania
Pima
Householder Income Over 65 years
Householder Income Over 65 years Comparison
Immigrants from Lithuania
Pima
$66,087
HOUSEHOLDER INCOME OVER 65 YEARS
99.5/ 100
METRIC RATING
60th/ 347
METRIC RANK
$50,539
HOUSEHOLDER INCOME OVER 65 YEARS
0.0/ 100
METRIC RATING
331st/ 347
METRIC RANK
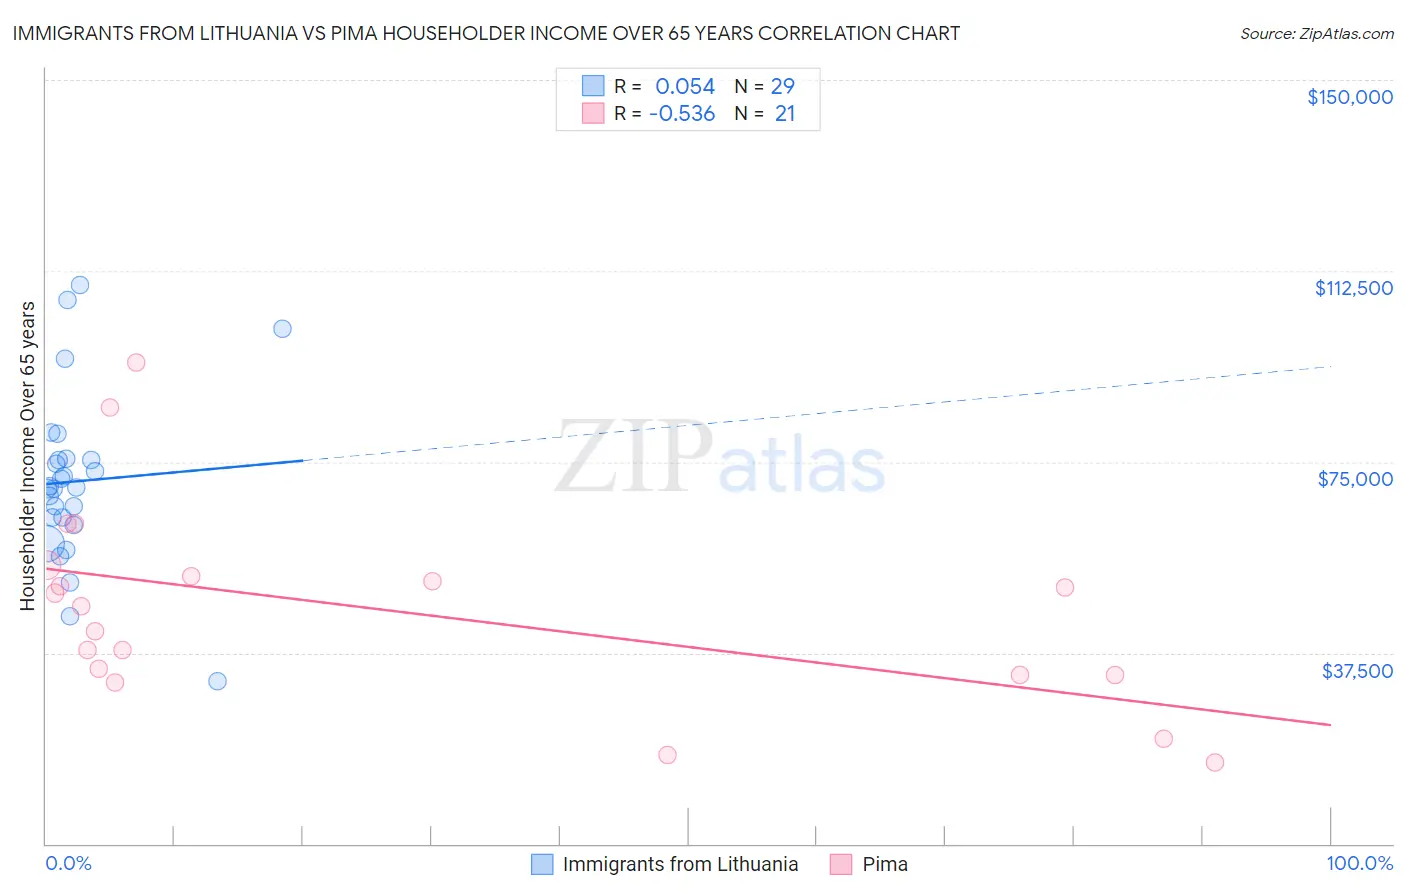
Immigrants from Lithuania vs Pima Householder Income Over 65 years Correlation Chart
The statistical analysis conducted on geographies consisting of 117,674,239 people shows a slight positive correlation between the proportion of Immigrants from Lithuania and household income with householder over the age of 65 in the United States with a correlation coefficient (R) of 0.054 and weighted average of $66,087. Similarly, the statistical analysis conducted on geographies consisting of 61,493,441 people shows a substantial negative correlation between the proportion of Pima and household income with householder over the age of 65 in the United States with a correlation coefficient (R) of -0.536 and weighted average of $50,539, a difference of 30.8%.
Householder Income Over 65 years Correlation Summary
| Measurement | Immigrants from Lithuania | Pima |
| Minimum | $31,875 | $15,972 |
| Maximum | $109,815 | $94,583 |
| Range | $77,940 | $78,611 |
| Mean | $71,191 | $45,976 |
| Median | $69,876 | $46,564 |
| Interquartile 25% (IQ1) | $63,362 | $33,050 |
| Interquartile 75% (IQ3) | $75,497 | $53,656 |
| Interquartile Range (IQR) | $12,135 | $20,606 |
| Standard Deviation (Sample) | $16,809 | $19,860 |
| Standard Deviation (Population) | $16,517 | $19,381 |
Similar Demographics by Householder Income Over 65 years
Demographics Similar to Immigrants from Lithuania by Householder Income Over 65 years
In terms of householder income over 65 years, the demographic groups most similar to Immigrants from Lithuania are Immigrants from Norway ($66,118, a difference of 0.050%), Maltese ($66,027, a difference of 0.090%), Immigrants from Philippines ($66,161, a difference of 0.11%), Immigrants from Sierra Leone ($66,009, a difference of 0.12%), and Bulgarian ($66,236, a difference of 0.22%).
| Demographics | Rating | Rank | Householder Income Over 65 years |
| Immigrants | Pakistan | 99.7 /100 | #53 | Exceptional $66,617 |
| Immigrants | Netherlands | 99.7 /100 | #54 | Exceptional $66,463 |
| Immigrants | Czechoslovakia | 99.7 /100 | #55 | Exceptional $66,376 |
| Laotians | 99.6 /100 | #56 | Exceptional $66,306 |
| Bulgarians | 99.6 /100 | #57 | Exceptional $66,236 |
| Immigrants | Philippines | 99.6 /100 | #58 | Exceptional $66,161 |
| Immigrants | Norway | 99.5 /100 | #59 | Exceptional $66,118 |
| Immigrants | Lithuania | 99.5 /100 | #60 | Exceptional $66,087 |
| Maltese | 99.5 /100 | #61 | Exceptional $66,027 |
| Immigrants | Sierra Leone | 99.5 /100 | #62 | Exceptional $66,009 |
| Marshallese | 99.4 /100 | #63 | Exceptional $65,874 |
| Zimbabweans | 99.4 /100 | #64 | Exceptional $65,854 |
| Immigrants | England | 99.3 /100 | #65 | Exceptional $65,715 |
| South Africans | 99.3 /100 | #66 | Exceptional $65,652 |
| Immigrants | Malaysia | 99.1 /100 | #67 | Exceptional $65,497 |
Demographics Similar to Pima by Householder Income Over 65 years
In terms of householder income over 65 years, the demographic groups most similar to Pima are Dutch West Indian ($50,475, a difference of 0.13%), Immigrants from Grenada ($50,747, a difference of 0.41%), Black/African American ($50,779, a difference of 0.47%), Hopi ($50,925, a difference of 0.76%), and Bahamian ($51,000, a difference of 0.91%).
| Demographics | Rating | Rank | Householder Income Over 65 years |
| Immigrants | Congo | 0.0 /100 | #324 | Tragic $51,393 |
| Immigrants | Haiti | 0.0 /100 | #325 | Tragic $51,219 |
| Kiowa | 0.0 /100 | #326 | Tragic $51,140 |
| Bahamians | 0.0 /100 | #327 | Tragic $51,000 |
| Hopi | 0.0 /100 | #328 | Tragic $50,925 |
| Blacks/African Americans | 0.0 /100 | #329 | Tragic $50,779 |
| Immigrants | Grenada | 0.0 /100 | #330 | Tragic $50,747 |
| Pima | 0.0 /100 | #331 | Tragic $50,539 |
| Dutch West Indians | 0.0 /100 | #332 | Tragic $50,475 |
| Cape Verdeans | 0.0 /100 | #333 | Tragic $50,077 |
| Immigrants | Dominica | 0.0 /100 | #334 | Tragic $50,071 |
| Crow | 0.0 /100 | #335 | Tragic $49,234 |
| Cubans | 0.0 /100 | #336 | Tragic $49,152 |
| Tohono O'odham | 0.0 /100 | #337 | Tragic $49,121 |
| Immigrants | Caribbean | 0.0 /100 | #338 | Tragic $48,535 |