Guamanian/Chamorro vs Cajun Householder Income Over 65 years
COMPARE
Guamanian/Chamorro
Cajun
Householder Income Over 65 years
Householder Income Over 65 years Comparison
Guamanians/Chamorros
Cajuns
$63,187
HOUSEHOLDER INCOME OVER 65 YEARS
91.1/ 100
METRIC RATING
116th/ 347
METRIC RANK
$51,397
HOUSEHOLDER INCOME OVER 65 YEARS
0.0/ 100
METRIC RATING
323rd/ 347
METRIC RANK
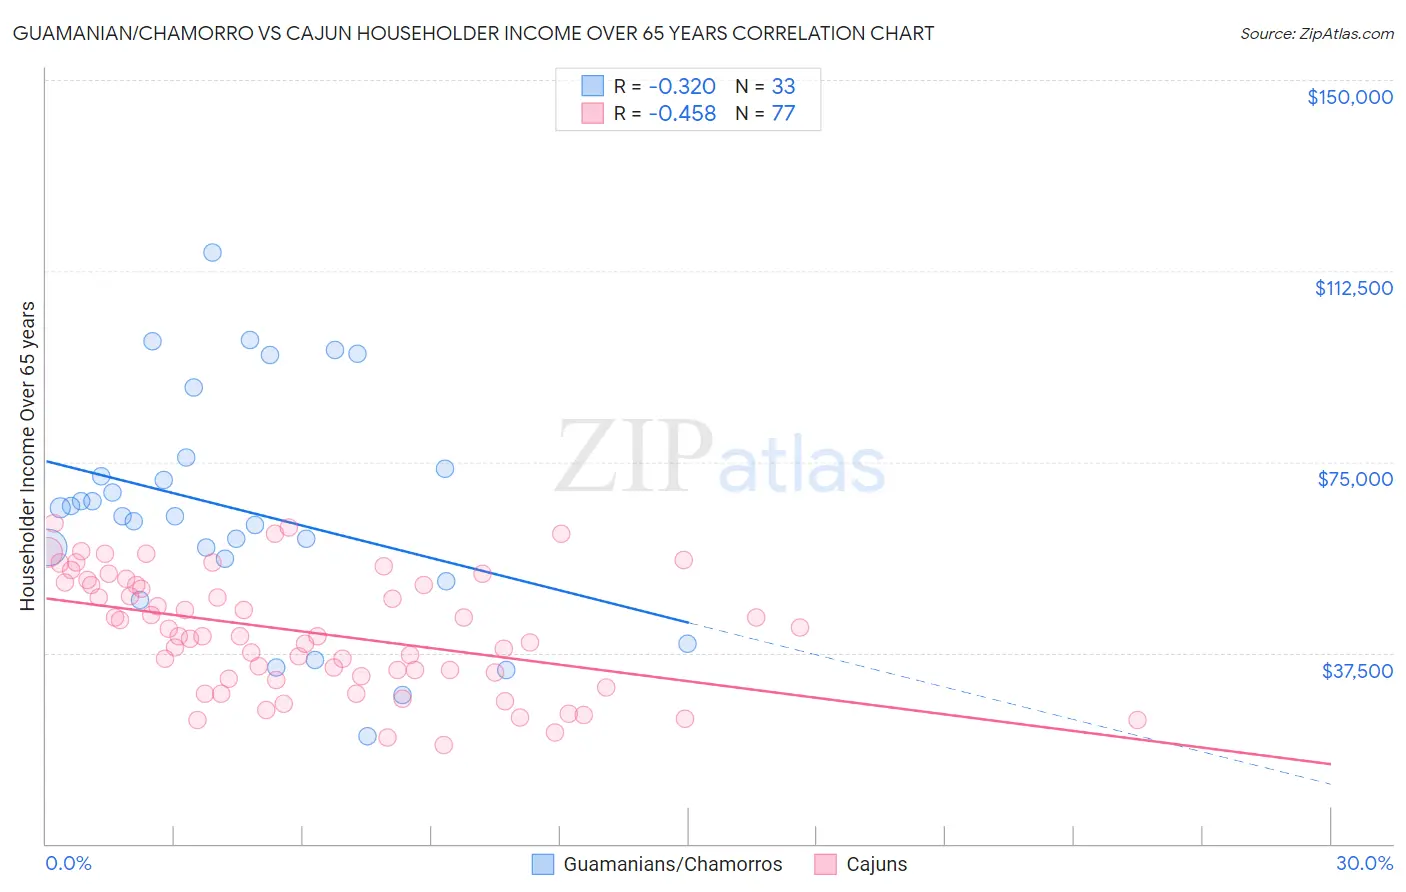
Guamanian/Chamorro vs Cajun Householder Income Over 65 years Correlation Chart
The statistical analysis conducted on geographies consisting of 221,091,968 people shows a mild negative correlation between the proportion of Guamanians/Chamorros and household income with householder over the age of 65 in the United States with a correlation coefficient (R) of -0.320 and weighted average of $63,187. Similarly, the statistical analysis conducted on geographies consisting of 149,395,361 people shows a moderate negative correlation between the proportion of Cajuns and household income with householder over the age of 65 in the United States with a correlation coefficient (R) of -0.458 and weighted average of $51,397, a difference of 22.9%.
Householder Income Over 65 years Correlation Summary
| Measurement | Guamanian/Chamorro | Cajun |
| Minimum | $21,071 | $19,375 |
| Maximum | $116,094 | $62,907 |
| Range | $95,023 | $43,532 |
| Mean | $65,533 | $41,476 |
| Median | $64,389 | $40,796 |
| Interquartile 25% (IQ1) | $53,785 | $32,741 |
| Interquartile 75% (IQ3) | $74,861 | $51,179 |
| Interquartile Range (IQR) | $21,076 | $18,438 |
| Standard Deviation (Sample) | $22,403 | $11,437 |
| Standard Deviation (Population) | $22,061 | $11,362 |
Similar Demographics by Householder Income Over 65 years
Demographics Similar to Guamanians/Chamorros by Householder Income Over 65 years
In terms of householder income over 65 years, the demographic groups most similar to Guamanians/Chamorros are Immigrants from Croatia ($63,168, a difference of 0.030%), Croatian ($63,225, a difference of 0.060%), Danish ($63,117, a difference of 0.11%), Immigrants from Jordan ($63,041, a difference of 0.23%), and Ukrainian ($63,032, a difference of 0.25%).
| Demographics | Rating | Rank | Householder Income Over 65 years |
| Europeans | 95.0 /100 | #109 | Exceptional $63,779 |
| Immigrants | Zimbabwe | 94.3 /100 | #110 | Exceptional $63,643 |
| Immigrants | Spain | 93.7 /100 | #111 | Exceptional $63,540 |
| Syrians | 93.4 /100 | #112 | Exceptional $63,494 |
| Immigrants | Serbia | 92.7 /100 | #113 | Exceptional $63,387 |
| Immigrants | Saudi Arabia | 92.4 /100 | #114 | Exceptional $63,355 |
| Croatians | 91.4 /100 | #115 | Exceptional $63,225 |
| Guamanians/Chamorros | 91.1 /100 | #116 | Exceptional $63,187 |
| Immigrants | Croatia | 90.9 /100 | #117 | Exceptional $63,168 |
| Danes | 90.5 /100 | #118 | Exceptional $63,117 |
| Immigrants | Jordan | 89.8 /100 | #119 | Excellent $63,041 |
| Ukrainians | 89.7 /100 | #120 | Excellent $63,032 |
| Immigrants | Vietnam | 89.5 /100 | #121 | Excellent $63,014 |
| Immigrants | Moldova | 88.7 /100 | #122 | Excellent $62,939 |
| Tlingit-Haida | 88.6 /100 | #123 | Excellent $62,922 |
Demographics Similar to Cajuns by Householder Income Over 65 years
In terms of householder income over 65 years, the demographic groups most similar to Cajuns are Immigrants from Congo ($51,393, a difference of 0.010%), British West Indian ($51,463, a difference of 0.13%), Immigrants from Haiti ($51,219, a difference of 0.35%), Kiowa ($51,140, a difference of 0.50%), and Menominee ($51,719, a difference of 0.63%).
| Demographics | Rating | Rank | Householder Income Over 65 years |
| Creek | 0.0 /100 | #316 | Tragic $51,949 |
| Immigrants | St. Vincent and the Grenadines | 0.0 /100 | #317 | Tragic $51,922 |
| Haitians | 0.0 /100 | #318 | Tragic $51,912 |
| Immigrants | Honduras | 0.0 /100 | #319 | Tragic $51,888 |
| Colville | 0.0 /100 | #320 | Tragic $51,739 |
| Menominee | 0.0 /100 | #321 | Tragic $51,719 |
| British West Indians | 0.0 /100 | #322 | Tragic $51,463 |
| Cajuns | 0.0 /100 | #323 | Tragic $51,397 |
| Immigrants | Congo | 0.0 /100 | #324 | Tragic $51,393 |
| Immigrants | Haiti | 0.0 /100 | #325 | Tragic $51,219 |
| Kiowa | 0.0 /100 | #326 | Tragic $51,140 |
| Bahamians | 0.0 /100 | #327 | Tragic $51,000 |
| Hopi | 0.0 /100 | #328 | Tragic $50,925 |
| Blacks/African Americans | 0.0 /100 | #329 | Tragic $50,779 |
| Immigrants | Grenada | 0.0 /100 | #330 | Tragic $50,747 |