Guamanian/Chamorro vs Pima Disability Age 35 to 64
COMPARE
Guamanian/Chamorro
Pima
Disability Age 35 to 64
Disability Age 35 to 64 Comparison
Guamanians/Chamorros
Pima
12.2%
DISABILITY AGE 35 TO 64
1.4/ 100
METRIC RATING
246th/ 347
METRIC RANK
16.1%
DISABILITY AGE 35 TO 64
0.0/ 100
METRIC RATING
339th/ 347
METRIC RANK
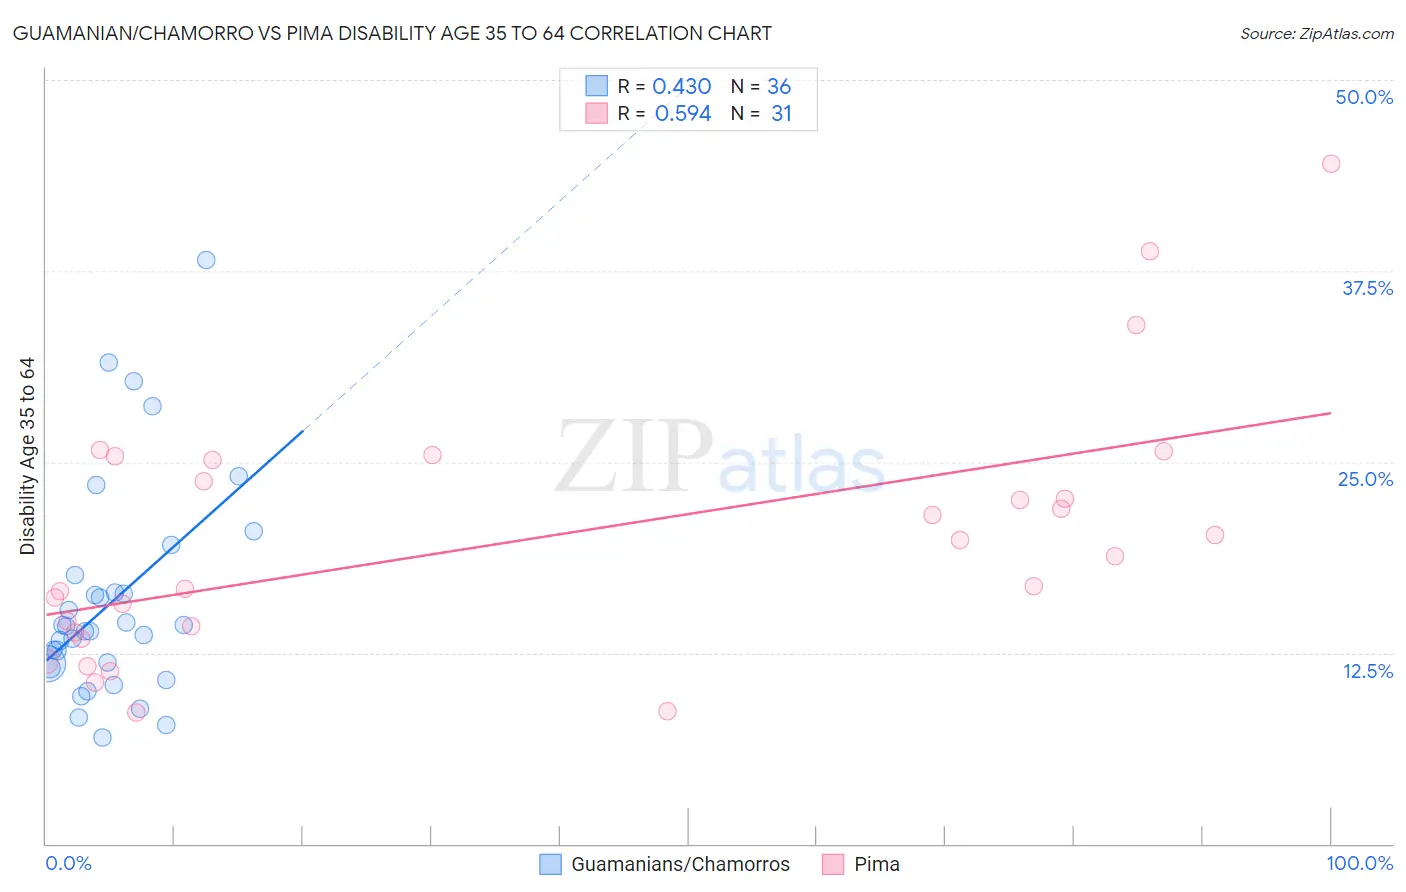
Guamanian/Chamorro vs Pima Disability Age 35 to 64 Correlation Chart
The statistical analysis conducted on geographies consisting of 221,858,951 people shows a moderate positive correlation between the proportion of Guamanians/Chamorros and percentage of population with a disability between the ages 34 and 64 in the United States with a correlation coefficient (R) of 0.430 and weighted average of 12.2%. Similarly, the statistical analysis conducted on geographies consisting of 61,540,994 people shows a substantial positive correlation between the proportion of Pima and percentage of population with a disability between the ages 34 and 64 in the United States with a correlation coefficient (R) of 0.594 and weighted average of 16.1%, a difference of 31.9%.
Disability Age 35 to 64 Correlation Summary
| Measurement | Guamanian/Chamorro | Pima |
| Minimum | 7.0% | 8.6% |
| Maximum | 38.2% | 44.5% |
| Range | 31.2% | 35.9% |
| Mean | 15.9% | 19.9% |
| Median | 14.1% | 18.9% |
| Interquartile 25% (IQ1) | 11.7% | 13.8% |
| Interquartile 75% (IQ3) | 17.0% | 25.1% |
| Interquartile Range (IQR) | 5.3% | 11.3% |
| Standard Deviation (Sample) | 7.1% | 8.4% |
| Standard Deviation (Population) | 7.0% | 8.2% |
Similar Demographics by Disability Age 35 to 64
Demographics Similar to Guamanians/Chamorros by Disability Age 35 to 64
In terms of disability age 35 to 64, the demographic groups most similar to Guamanians/Chamorros are Immigrants from Senegal (12.2%, a difference of 0.040%), Spaniard (12.3%, a difference of 0.13%), Hispanic or Latino (12.3%, a difference of 0.16%), Immigrants from Burma/Myanmar (12.3%, a difference of 0.29%), and German (12.3%, a difference of 0.37%).
| Demographics | Rating | Rank | Disability Age 35 to 64 |
| Immigrants | Western Africa | 3.3 /100 | #239 | Tragic 12.0% |
| Immigrants | Thailand | 3.3 /100 | #240 | Tragic 12.0% |
| Mexican American Indians | 3.2 /100 | #241 | Tragic 12.0% |
| Samoans | 2.8 /100 | #242 | Tragic 12.1% |
| Slovaks | 2.7 /100 | #243 | Tragic 12.1% |
| Finns | 2.3 /100 | #244 | Tragic 12.1% |
| Immigrants | Mexico | 2.2 /100 | #245 | Tragic 12.1% |
| Guamanians/Chamorros | 1.4 /100 | #246 | Tragic 12.2% |
| Immigrants | Senegal | 1.3 /100 | #247 | Tragic 12.2% |
| Spaniards | 1.3 /100 | #248 | Tragic 12.3% |
| Hispanics or Latinos | 1.3 /100 | #249 | Tragic 12.3% |
| Immigrants | Burma/Myanmar | 1.2 /100 | #250 | Tragic 12.3% |
| Germans | 1.1 /100 | #251 | Tragic 12.3% |
| Irish | 1.0 /100 | #252 | Tragic 12.3% |
| Dutch | 1.0 /100 | #253 | Tragic 12.3% |
Demographics Similar to Pima by Disability Age 35 to 64
In terms of disability age 35 to 64, the demographic groups most similar to Pima are Chickasaw (16.1%, a difference of 0.20%), Puerto Rican (15.9%, a difference of 1.2%), Menominee (15.9%, a difference of 1.6%), Choctaw (16.4%, a difference of 1.7%), and Seminole (15.9%, a difference of 1.8%).
| Demographics | Rating | Rank | Disability Age 35 to 64 |
| Alaskan Athabascans | 0.0 /100 | #332 | Tragic 15.7% |
| Yuman | 0.0 /100 | #333 | Tragic 15.8% |
| Colville | 0.0 /100 | #334 | Tragic 15.8% |
| Seminole | 0.0 /100 | #335 | Tragic 15.9% |
| Menominee | 0.0 /100 | #336 | Tragic 15.9% |
| Puerto Ricans | 0.0 /100 | #337 | Tragic 15.9% |
| Chickasaw | 0.0 /100 | #338 | Tragic 16.1% |
| Pima | 0.0 /100 | #339 | Tragic 16.1% |
| Choctaw | 0.0 /100 | #340 | Tragic 16.4% |
| Tsimshian | 0.0 /100 | #341 | Tragic 16.7% |
| Tohono O'odham | 0.0 /100 | #342 | Tragic 16.7% |
| Creek | 0.0 /100 | #343 | Tragic 16.9% |
| Yup'ik | 0.0 /100 | #344 | Tragic 16.9% |
| Kiowa | 0.0 /100 | #345 | Tragic 17.4% |
| Lumbee | 0.0 /100 | #346 | Tragic 17.6% |