Hopi vs Pima Householder Income Over 65 years
COMPARE
Hopi
Pima
Householder Income Over 65 years
Householder Income Over 65 years Comparison
Hopi
Pima
$50,925
HOUSEHOLDER INCOME OVER 65 YEARS
0.0/ 100
METRIC RATING
328th/ 347
METRIC RANK
$50,539
HOUSEHOLDER INCOME OVER 65 YEARS
0.0/ 100
METRIC RATING
331st/ 347
METRIC RANK
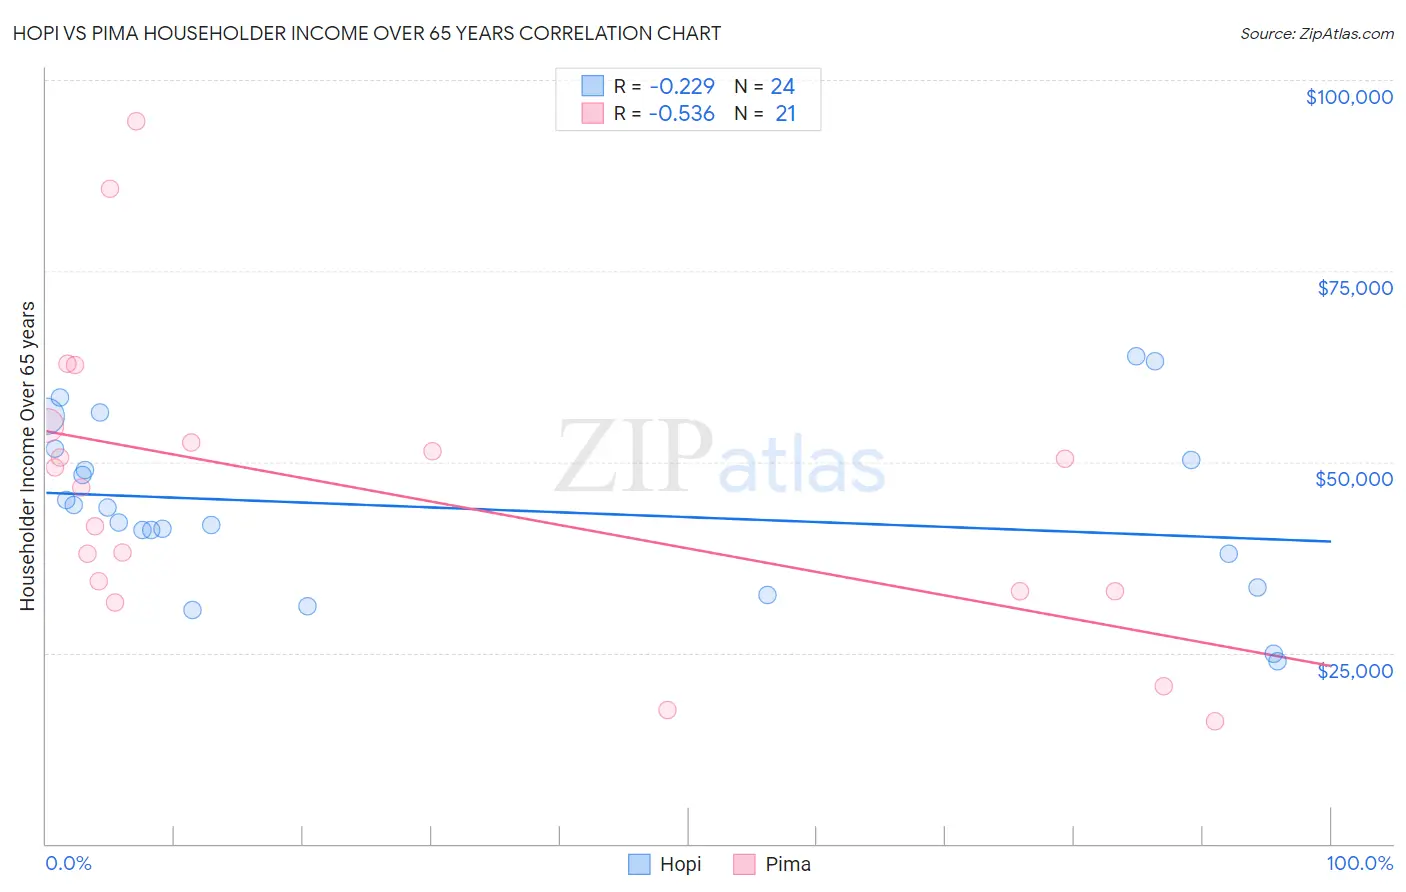
Hopi vs Pima Householder Income Over 65 years Correlation Chart
The statistical analysis conducted on geographies consisting of 74,624,993 people shows a weak negative correlation between the proportion of Hopi and household income with householder over the age of 65 in the United States with a correlation coefficient (R) of -0.229 and weighted average of $50,925. Similarly, the statistical analysis conducted on geographies consisting of 61,493,441 people shows a substantial negative correlation between the proportion of Pima and household income with householder over the age of 65 in the United States with a correlation coefficient (R) of -0.536 and weighted average of $50,539, a difference of 0.76%.
Householder Income Over 65 years Correlation Summary
| Measurement | Hopi | Pima |
| Minimum | $23,945 | $15,972 |
| Maximum | $63,889 | $94,583 |
| Range | $39,944 | $78,611 |
| Mean | $43,849 | $45,976 |
| Median | $43,086 | $46,564 |
| Interquartile 25% (IQ1) | $35,807 | $33,050 |
| Interquartile 75% (IQ3) | $50,986 | $53,656 |
| Interquartile Range (IQR) | $15,179 | $20,606 |
| Standard Deviation (Sample) | $11,101 | $19,860 |
| Standard Deviation (Population) | $10,867 | $19,381 |
Demographics Similar to Hopi and Pima by Householder Income Over 65 years
In terms of householder income over 65 years, the demographic groups most similar to Hopi are Bahamian ($51,000, a difference of 0.15%), Black/African American ($50,779, a difference of 0.29%), Immigrants from Grenada ($50,747, a difference of 0.35%), Kiowa ($51,140, a difference of 0.42%), and Immigrants from Haiti ($51,219, a difference of 0.58%). Similarly, the demographic groups most similar to Pima are Dutch West Indian ($50,475, a difference of 0.13%), Immigrants from Grenada ($50,747, a difference of 0.41%), Black/African American ($50,779, a difference of 0.47%), Bahamian ($51,000, a difference of 0.91%), and Cape Verdean ($50,077, a difference of 0.92%).
| Demographics | Rating | Rank | Householder Income Over 65 years |
| Immigrants | Honduras | 0.0 /100 | #319 | Tragic $51,888 |
| Colville | 0.0 /100 | #320 | Tragic $51,739 |
| Menominee | 0.0 /100 | #321 | Tragic $51,719 |
| British West Indians | 0.0 /100 | #322 | Tragic $51,463 |
| Cajuns | 0.0 /100 | #323 | Tragic $51,397 |
| Immigrants | Congo | 0.0 /100 | #324 | Tragic $51,393 |
| Immigrants | Haiti | 0.0 /100 | #325 | Tragic $51,219 |
| Kiowa | 0.0 /100 | #326 | Tragic $51,140 |
| Bahamians | 0.0 /100 | #327 | Tragic $51,000 |
| Hopi | 0.0 /100 | #328 | Tragic $50,925 |
| Blacks/African Americans | 0.0 /100 | #329 | Tragic $50,779 |
| Immigrants | Grenada | 0.0 /100 | #330 | Tragic $50,747 |
| Pima | 0.0 /100 | #331 | Tragic $50,539 |
| Dutch West Indians | 0.0 /100 | #332 | Tragic $50,475 |
| Cape Verdeans | 0.0 /100 | #333 | Tragic $50,077 |
| Immigrants | Dominica | 0.0 /100 | #334 | Tragic $50,071 |
| Crow | 0.0 /100 | #335 | Tragic $49,234 |
| Cubans | 0.0 /100 | #336 | Tragic $49,152 |
| Tohono O'odham | 0.0 /100 | #337 | Tragic $49,121 |
| Immigrants | Caribbean | 0.0 /100 | #338 | Tragic $48,535 |
| Navajo | 0.0 /100 | #339 | Tragic $47,722 |