Guamanian/Chamorro vs Hawaiian Householder Income Over 65 years
COMPARE
Guamanian/Chamorro
Hawaiian
Householder Income Over 65 years
Householder Income Over 65 years Comparison
Guamanians/Chamorros
Hawaiians
$63,187
HOUSEHOLDER INCOME OVER 65 YEARS
91.1/ 100
METRIC RATING
116th/ 347
METRIC RANK
$64,920
HOUSEHOLDER INCOME OVER 65 YEARS
98.4/ 100
METRIC RATING
79th/ 347
METRIC RANK
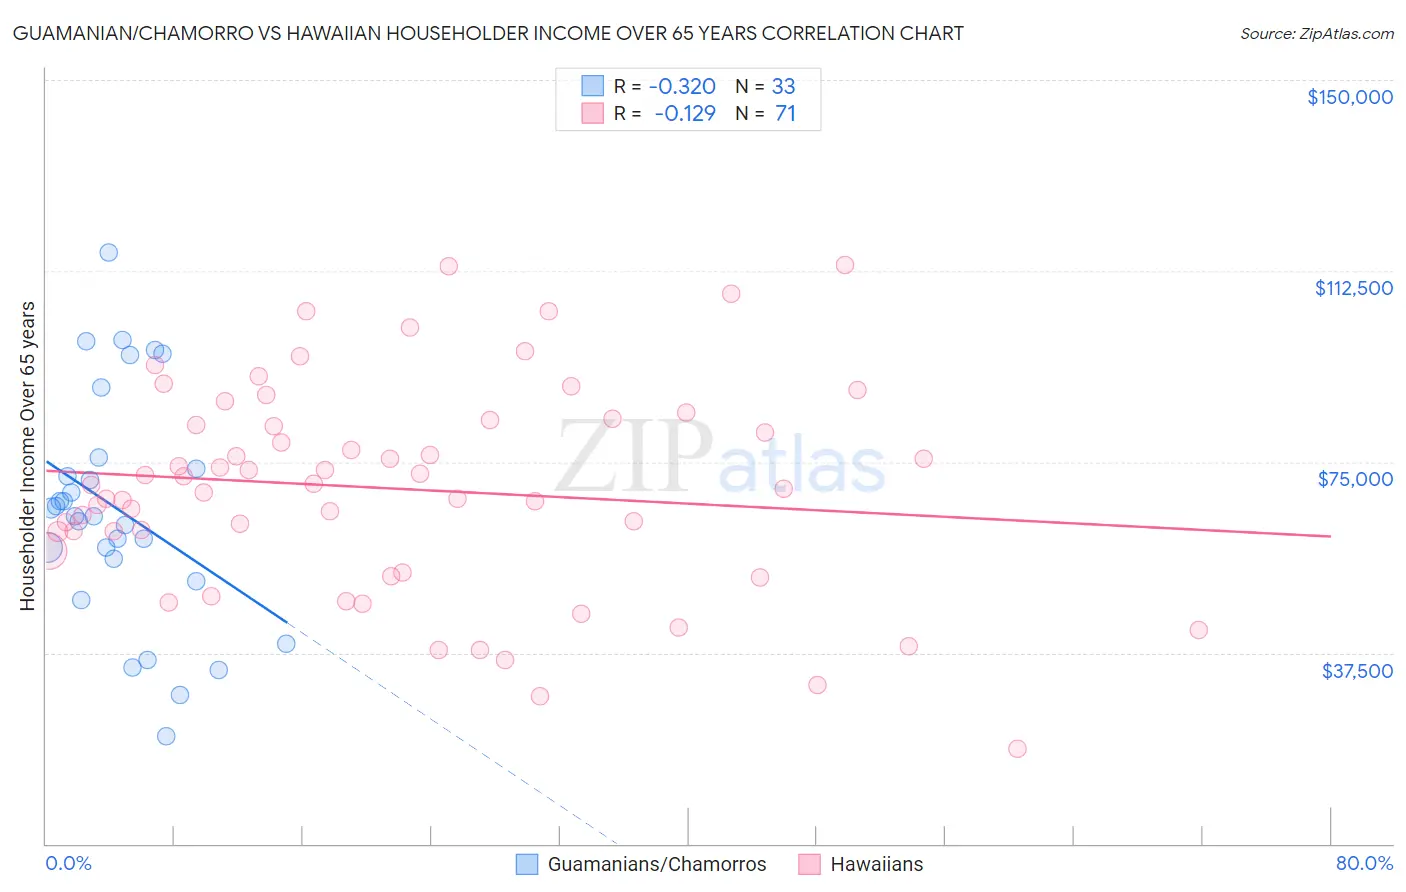
Guamanian/Chamorro vs Hawaiian Householder Income Over 65 years Correlation Chart
The statistical analysis conducted on geographies consisting of 221,091,968 people shows a mild negative correlation between the proportion of Guamanians/Chamorros and household income with householder over the age of 65 in the United States with a correlation coefficient (R) of -0.320 and weighted average of $63,187. Similarly, the statistical analysis conducted on geographies consisting of 326,215,484 people shows a poor negative correlation between the proportion of Hawaiians and household income with householder over the age of 65 in the United States with a correlation coefficient (R) of -0.129 and weighted average of $64,920, a difference of 2.7%.
Householder Income Over 65 years Correlation Summary
| Measurement | Guamanian/Chamorro | Hawaiian |
| Minimum | $21,071 | $18,720 |
| Maximum | $116,094 | $113,750 |
| Range | $95,023 | $95,030 |
| Mean | $65,533 | $69,704 |
| Median | $64,389 | $70,484 |
| Interquartile 25% (IQ1) | $53,785 | $57,420 |
| Interquartile 75% (IQ3) | $74,861 | $83,133 |
| Interquartile Range (IQR) | $21,076 | $25,713 |
| Standard Deviation (Sample) | $22,403 | $20,668 |
| Standard Deviation (Population) | $22,061 | $20,522 |
Similar Demographics by Householder Income Over 65 years
Demographics Similar to Guamanians/Chamorros by Householder Income Over 65 years
In terms of householder income over 65 years, the demographic groups most similar to Guamanians/Chamorros are Immigrants from Croatia ($63,168, a difference of 0.030%), Croatian ($63,225, a difference of 0.060%), Danish ($63,117, a difference of 0.11%), Immigrants from Jordan ($63,041, a difference of 0.23%), and Ukrainian ($63,032, a difference of 0.25%).
| Demographics | Rating | Rank | Householder Income Over 65 years |
| Europeans | 95.0 /100 | #109 | Exceptional $63,779 |
| Immigrants | Zimbabwe | 94.3 /100 | #110 | Exceptional $63,643 |
| Immigrants | Spain | 93.7 /100 | #111 | Exceptional $63,540 |
| Syrians | 93.4 /100 | #112 | Exceptional $63,494 |
| Immigrants | Serbia | 92.7 /100 | #113 | Exceptional $63,387 |
| Immigrants | Saudi Arabia | 92.4 /100 | #114 | Exceptional $63,355 |
| Croatians | 91.4 /100 | #115 | Exceptional $63,225 |
| Guamanians/Chamorros | 91.1 /100 | #116 | Exceptional $63,187 |
| Immigrants | Croatia | 90.9 /100 | #117 | Exceptional $63,168 |
| Danes | 90.5 /100 | #118 | Exceptional $63,117 |
| Immigrants | Jordan | 89.8 /100 | #119 | Excellent $63,041 |
| Ukrainians | 89.7 /100 | #120 | Excellent $63,032 |
| Immigrants | Vietnam | 89.5 /100 | #121 | Excellent $63,014 |
| Immigrants | Moldova | 88.7 /100 | #122 | Excellent $62,939 |
| Tlingit-Haida | 88.6 /100 | #123 | Excellent $62,922 |
Demographics Similar to Hawaiians by Householder Income Over 65 years
In terms of householder income over 65 years, the demographic groups most similar to Hawaiians are Immigrants from Western Europe ($64,933, a difference of 0.020%), Immigrants from Canada ($64,952, a difference of 0.050%), Immigrants from North America ($64,856, a difference of 0.10%), Ethiopian ($64,989, a difference of 0.11%), and Immigrants from Europe ($64,828, a difference of 0.14%).
| Demographics | Rating | Rank | Householder Income Over 65 years |
| Argentineans | 98.9 /100 | #72 | Exceptional $65,246 |
| Immigrants | Ethiopia | 98.9 /100 | #73 | Exceptional $65,238 |
| Lithuanians | 98.8 /100 | #74 | Exceptional $65,209 |
| Sierra Leoneans | 98.6 /100 | #75 | Exceptional $65,038 |
| Ethiopians | 98.5 /100 | #76 | Exceptional $64,989 |
| Immigrants | Canada | 98.5 /100 | #77 | Exceptional $64,952 |
| Immigrants | Western Europe | 98.5 /100 | #78 | Exceptional $64,933 |
| Hawaiians | 98.4 /100 | #79 | Exceptional $64,920 |
| Immigrants | North America | 98.3 /100 | #80 | Exceptional $64,856 |
| Immigrants | Europe | 98.3 /100 | #81 | Exceptional $64,828 |
| Immigrants | Fiji | 98.2 /100 | #82 | Exceptional $64,795 |
| Northern Europeans | 97.9 /100 | #83 | Exceptional $64,658 |
| Immigrants | Greece | 97.9 /100 | #84 | Exceptional $64,636 |
| Immigrants | Lebanon | 97.6 /100 | #85 | Exceptional $64,521 |
| Immigrants | Russia | 97.6 /100 | #86 | Exceptional $64,512 |