Guamanian/Chamorro vs Panamanian Householder Income Over 65 years
COMPARE
Guamanian/Chamorro
Panamanian
Householder Income Over 65 years
Householder Income Over 65 years Comparison
Guamanians/Chamorros
Panamanians
$63,187
HOUSEHOLDER INCOME OVER 65 YEARS
91.1/ 100
METRIC RATING
116th/ 347
METRIC RANK
$58,266
HOUSEHOLDER INCOME OVER 65 YEARS
5.6/ 100
METRIC RATING
218th/ 347
METRIC RANK
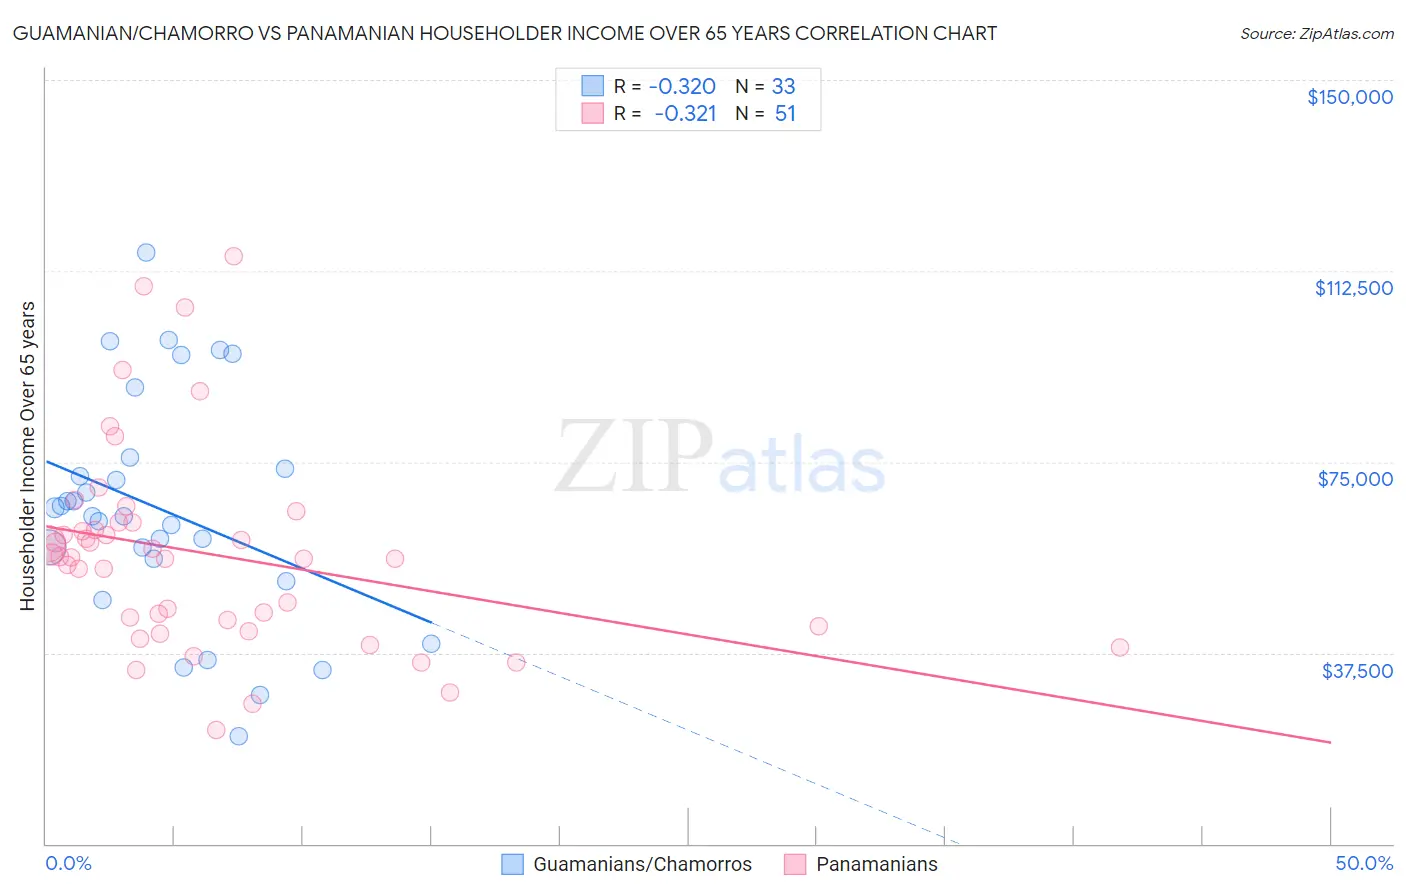
Guamanian/Chamorro vs Panamanian Householder Income Over 65 years Correlation Chart
The statistical analysis conducted on geographies consisting of 221,091,968 people shows a mild negative correlation between the proportion of Guamanians/Chamorros and household income with householder over the age of 65 in the United States with a correlation coefficient (R) of -0.320 and weighted average of $63,187. Similarly, the statistical analysis conducted on geographies consisting of 280,268,554 people shows a mild negative correlation between the proportion of Panamanians and household income with householder over the age of 65 in the United States with a correlation coefficient (R) of -0.321 and weighted average of $58,266, a difference of 8.5%.
Householder Income Over 65 years Correlation Summary
| Measurement | Guamanian/Chamorro | Panamanian |
| Minimum | $21,071 | $22,448 |
| Maximum | $116,094 | $115,417 |
| Range | $95,023 | $92,969 |
| Mean | $65,533 | $56,997 |
| Median | $64,389 | $56,289 |
| Interquartile 25% (IQ1) | $53,785 | $42,656 |
| Interquartile 75% (IQ3) | $74,861 | $63,024 |
| Interquartile Range (IQR) | $21,076 | $20,368 |
| Standard Deviation (Sample) | $22,403 | $19,848 |
| Standard Deviation (Population) | $22,061 | $19,652 |
Similar Demographics by Householder Income Over 65 years
Demographics Similar to Guamanians/Chamorros by Householder Income Over 65 years
In terms of householder income over 65 years, the demographic groups most similar to Guamanians/Chamorros are Immigrants from Croatia ($63,168, a difference of 0.030%), Croatian ($63,225, a difference of 0.060%), Danish ($63,117, a difference of 0.11%), Immigrants from Jordan ($63,041, a difference of 0.23%), and Ukrainian ($63,032, a difference of 0.25%).
| Demographics | Rating | Rank | Householder Income Over 65 years |
| Europeans | 95.0 /100 | #109 | Exceptional $63,779 |
| Immigrants | Zimbabwe | 94.3 /100 | #110 | Exceptional $63,643 |
| Immigrants | Spain | 93.7 /100 | #111 | Exceptional $63,540 |
| Syrians | 93.4 /100 | #112 | Exceptional $63,494 |
| Immigrants | Serbia | 92.7 /100 | #113 | Exceptional $63,387 |
| Immigrants | Saudi Arabia | 92.4 /100 | #114 | Exceptional $63,355 |
| Croatians | 91.4 /100 | #115 | Exceptional $63,225 |
| Guamanians/Chamorros | 91.1 /100 | #116 | Exceptional $63,187 |
| Immigrants | Croatia | 90.9 /100 | #117 | Exceptional $63,168 |
| Danes | 90.5 /100 | #118 | Exceptional $63,117 |
| Immigrants | Jordan | 89.8 /100 | #119 | Excellent $63,041 |
| Ukrainians | 89.7 /100 | #120 | Excellent $63,032 |
| Immigrants | Vietnam | 89.5 /100 | #121 | Excellent $63,014 |
| Immigrants | Moldova | 88.7 /100 | #122 | Excellent $62,939 |
| Tlingit-Haida | 88.6 /100 | #123 | Excellent $62,922 |
Demographics Similar to Panamanians by Householder Income Over 65 years
In terms of householder income over 65 years, the demographic groups most similar to Panamanians are Sudanese ($58,281, a difference of 0.030%), Malaysian ($58,244, a difference of 0.040%), Yugoslavian ($58,243, a difference of 0.040%), Immigrants from El Salvador ($58,226, a difference of 0.070%), and Delaware ($58,214, a difference of 0.090%).
| Demographics | Rating | Rank | Householder Income Over 65 years |
| Immigrants | Nigeria | 10.7 /100 | #211 | Poor $58,942 |
| Colombians | 9.8 /100 | #212 | Tragic $58,851 |
| Whites/Caucasians | 9.8 /100 | #213 | Tragic $58,847 |
| Nepalese | 9.0 /100 | #214 | Tragic $58,761 |
| Immigrants | Ghana | 7.9 /100 | #215 | Tragic $58,624 |
| Immigrants | Middle Africa | 6.2 /100 | #216 | Tragic $58,375 |
| Sudanese | 5.7 /100 | #217 | Tragic $58,281 |
| Panamanians | 5.6 /100 | #218 | Tragic $58,266 |
| Malaysians | 5.5 /100 | #219 | Tragic $58,244 |
| Yugoslavians | 5.5 /100 | #220 | Tragic $58,243 |
| Immigrants | El Salvador | 5.4 /100 | #221 | Tragic $58,226 |
| Delaware | 5.3 /100 | #222 | Tragic $58,214 |
| Tsimshian | 5.2 /100 | #223 | Tragic $58,202 |
| Bermudans | 5.1 /100 | #224 | Tragic $58,171 |
| Venezuelans | 4.4 /100 | #225 | Tragic $58,026 |