Guamanian/Chamorro vs Polish Householder Income Over 65 years
COMPARE
Guamanian/Chamorro
Polish
Householder Income Over 65 years
Householder Income Over 65 years Comparison
Guamanians/Chamorros
Poles
$63,187
HOUSEHOLDER INCOME OVER 65 YEARS
91.1/ 100
METRIC RATING
116th/ 347
METRIC RANK
$61,598
HOUSEHOLDER INCOME OVER 65 YEARS
65.9/ 100
METRIC RATING
155th/ 347
METRIC RANK
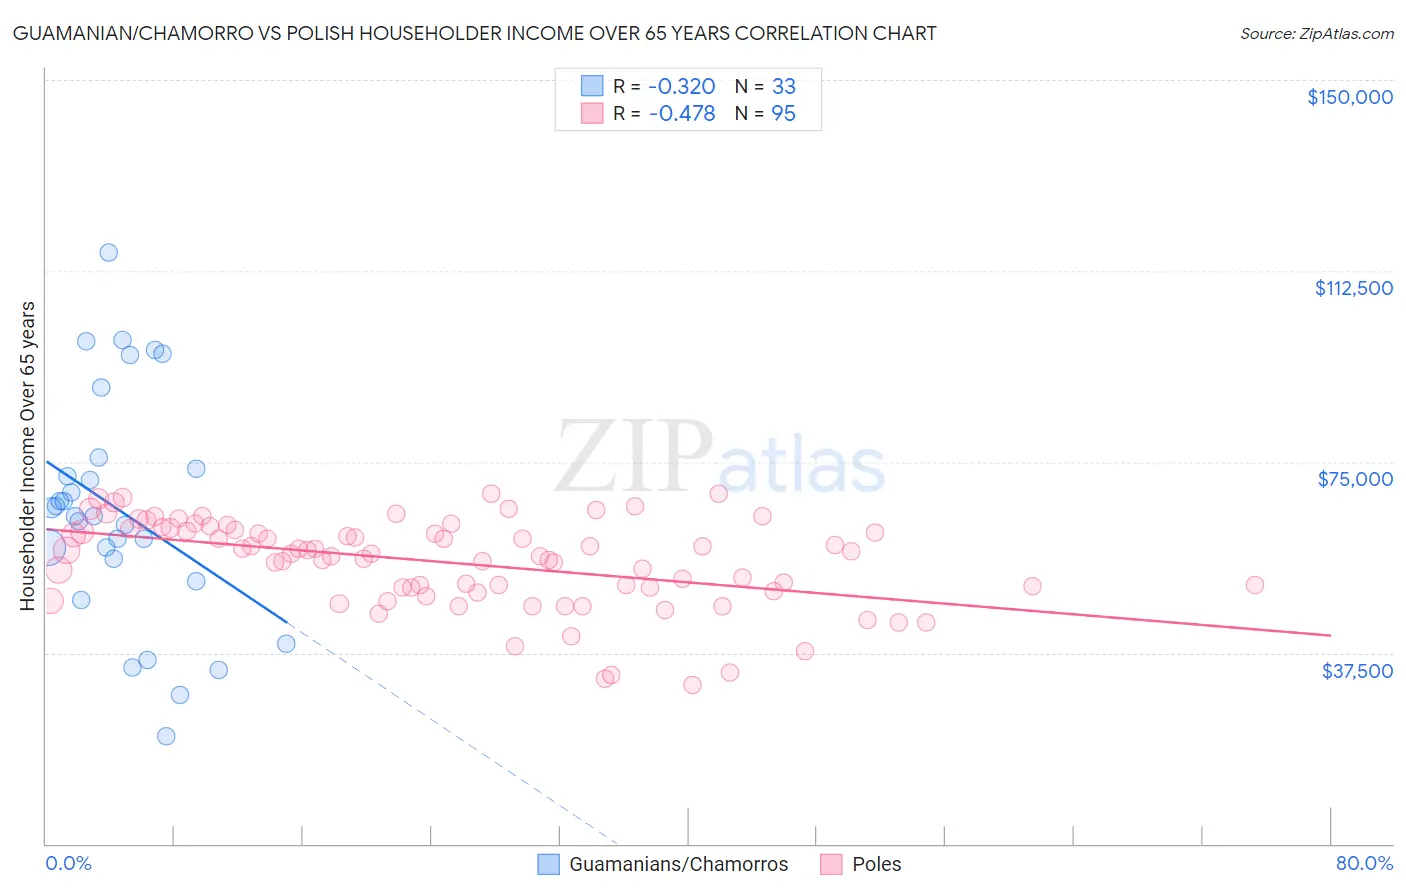
Guamanian/Chamorro vs Polish Householder Income Over 65 years Correlation Chart
The statistical analysis conducted on geographies consisting of 221,091,968 people shows a mild negative correlation between the proportion of Guamanians/Chamorros and household income with householder over the age of 65 in the United States with a correlation coefficient (R) of -0.320 and weighted average of $63,187. Similarly, the statistical analysis conducted on geographies consisting of 555,812,342 people shows a moderate negative correlation between the proportion of Poles and household income with householder over the age of 65 in the United States with a correlation coefficient (R) of -0.478 and weighted average of $61,598, a difference of 2.6%.
Householder Income Over 65 years Correlation Summary
| Measurement | Guamanian/Chamorro | Polish |
| Minimum | $21,071 | $31,125 |
| Maximum | $116,094 | $68,837 |
| Range | $95,023 | $37,712 |
| Mean | $65,533 | $55,277 |
| Median | $64,389 | $57,047 |
| Interquartile 25% (IQ1) | $53,785 | $50,250 |
| Interquartile 75% (IQ3) | $74,861 | $61,924 |
| Interquartile Range (IQR) | $21,076 | $11,674 |
| Standard Deviation (Sample) | $22,403 | $8,677 |
| Standard Deviation (Population) | $22,061 | $8,631 |
Similar Demographics by Householder Income Over 65 years
Demographics Similar to Guamanians/Chamorros by Householder Income Over 65 years
In terms of householder income over 65 years, the demographic groups most similar to Guamanians/Chamorros are Immigrants from Croatia ($63,168, a difference of 0.030%), Croatian ($63,225, a difference of 0.060%), Danish ($63,117, a difference of 0.11%), Immigrants from Jordan ($63,041, a difference of 0.23%), and Ukrainian ($63,032, a difference of 0.25%).
| Demographics | Rating | Rank | Householder Income Over 65 years |
| Europeans | 95.0 /100 | #109 | Exceptional $63,779 |
| Immigrants | Zimbabwe | 94.3 /100 | #110 | Exceptional $63,643 |
| Immigrants | Spain | 93.7 /100 | #111 | Exceptional $63,540 |
| Syrians | 93.4 /100 | #112 | Exceptional $63,494 |
| Immigrants | Serbia | 92.7 /100 | #113 | Exceptional $63,387 |
| Immigrants | Saudi Arabia | 92.4 /100 | #114 | Exceptional $63,355 |
| Croatians | 91.4 /100 | #115 | Exceptional $63,225 |
| Guamanians/Chamorros | 91.1 /100 | #116 | Exceptional $63,187 |
| Immigrants | Croatia | 90.9 /100 | #117 | Exceptional $63,168 |
| Danes | 90.5 /100 | #118 | Exceptional $63,117 |
| Immigrants | Jordan | 89.8 /100 | #119 | Excellent $63,041 |
| Ukrainians | 89.7 /100 | #120 | Excellent $63,032 |
| Immigrants | Vietnam | 89.5 /100 | #121 | Excellent $63,014 |
| Immigrants | Moldova | 88.7 /100 | #122 | Excellent $62,939 |
| Tlingit-Haida | 88.6 /100 | #123 | Excellent $62,922 |
Demographics Similar to Poles by Householder Income Over 65 years
In terms of householder income over 65 years, the demographic groups most similar to Poles are Scandinavian ($61,586, a difference of 0.020%), Swiss ($61,621, a difference of 0.040%), Costa Rican ($61,638, a difference of 0.060%), Macedonian ($61,564, a difference of 0.060%), and Armenian ($61,656, a difference of 0.090%).
| Demographics | Rating | Rank | Householder Income Over 65 years |
| Alsatians | 70.5 /100 | #148 | Good $61,797 |
| Scottish | 69.1 /100 | #149 | Good $61,735 |
| Slavs | 68.5 /100 | #150 | Good $61,709 |
| Hungarians | 67.7 /100 | #151 | Good $61,673 |
| Armenians | 67.3 /100 | #152 | Good $61,656 |
| Costa Ricans | 66.9 /100 | #153 | Good $61,638 |
| Swiss | 66.5 /100 | #154 | Good $61,621 |
| Poles | 65.9 /100 | #155 | Good $61,598 |
| Scandinavians | 65.6 /100 | #156 | Good $61,586 |
| Macedonians | 65.1 /100 | #157 | Good $61,564 |
| English | 63.3 /100 | #158 | Good $61,487 |
| Brazilians | 62.7 /100 | #159 | Good $61,465 |
| Portuguese | 62.1 /100 | #160 | Good $61,440 |
| Icelanders | 57.9 /100 | #161 | Average $61,270 |
| Czechs | 57.2 /100 | #162 | Average $61,244 |