Mongolian vs Pima Householder Income Over 65 years
COMPARE
Mongolian
Pima
Householder Income Over 65 years
Householder Income Over 65 years Comparison
Mongolians
Pima
$65,326
HOUSEHOLDER INCOME OVER 65 YEARS
99.0/ 100
METRIC RATING
70th/ 347
METRIC RANK
$50,539
HOUSEHOLDER INCOME OVER 65 YEARS
0.0/ 100
METRIC RATING
331st/ 347
METRIC RANK
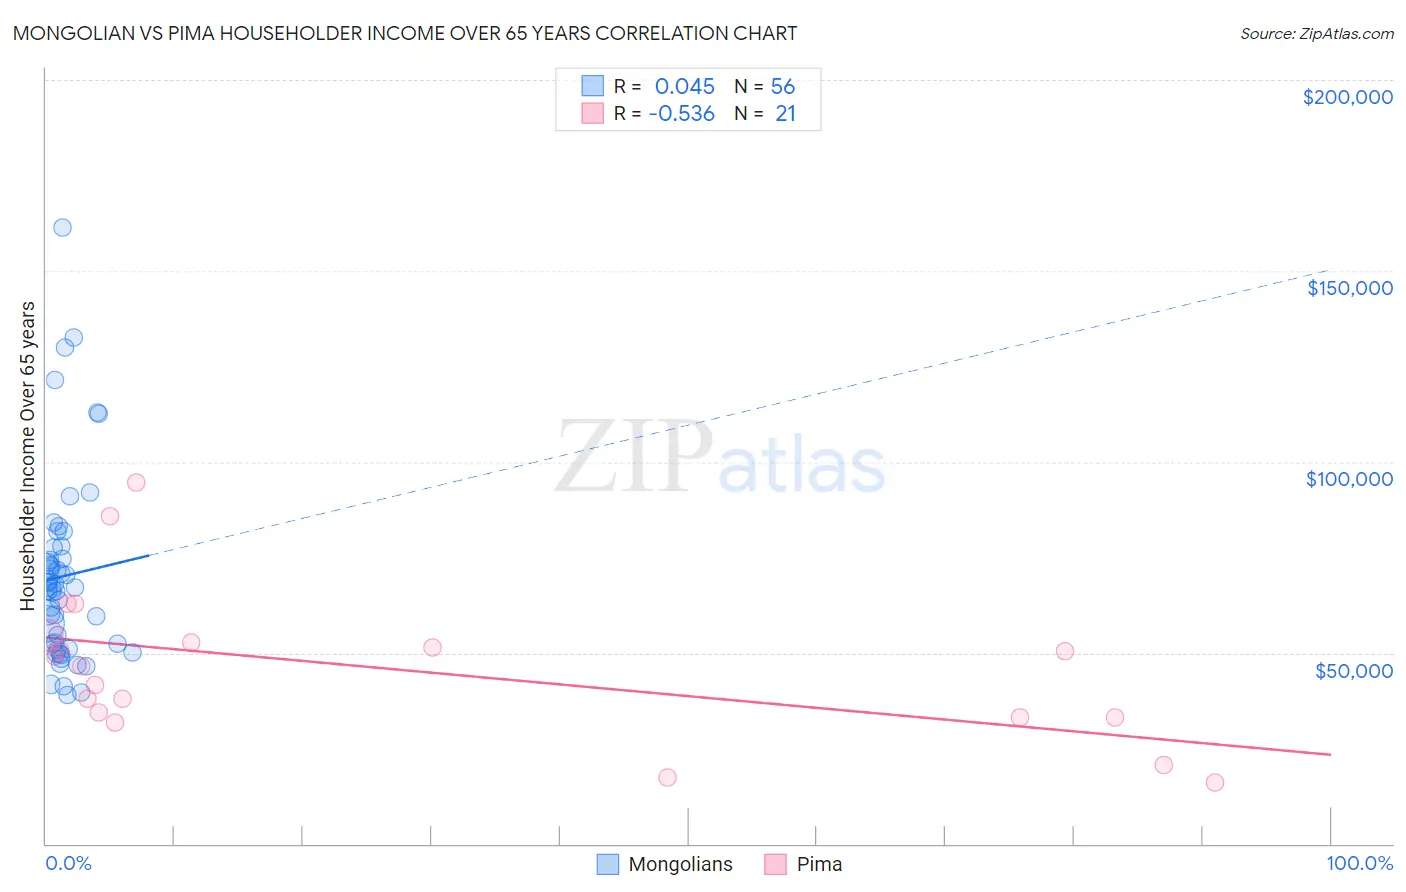
Mongolian vs Pima Householder Income Over 65 years Correlation Chart
The statistical analysis conducted on geographies consisting of 140,116,166 people shows no correlation between the proportion of Mongolians and household income with householder over the age of 65 in the United States with a correlation coefficient (R) of 0.045 and weighted average of $65,326. Similarly, the statistical analysis conducted on geographies consisting of 61,493,441 people shows a substantial negative correlation between the proportion of Pima and household income with householder over the age of 65 in the United States with a correlation coefficient (R) of -0.536 and weighted average of $50,539, a difference of 29.3%.
Householder Income Over 65 years Correlation Summary
| Measurement | Mongolian | Pima |
| Minimum | $39,115 | $15,972 |
| Maximum | $161,250 | $94,583 |
| Range | $122,135 | $78,611 |
| Mean | $70,084 | $45,976 |
| Median | $66,894 | $46,564 |
| Interquartile 25% (IQ1) | $51,691 | $33,050 |
| Interquartile 75% (IQ3) | $76,091 | $53,656 |
| Interquartile Range (IQR) | $24,400 | $20,606 |
| Standard Deviation (Sample) | $24,736 | $19,860 |
| Standard Deviation (Population) | $24,514 | $19,381 |
Similar Demographics by Householder Income Over 65 years
Demographics Similar to Mongolians by Householder Income Over 65 years
In terms of householder income over 65 years, the demographic groups most similar to Mongolians are Greek ($65,306, a difference of 0.030%), Argentinean ($65,246, a difference of 0.12%), Immigrants from Ethiopia ($65,238, a difference of 0.13%), Samoan ($65,427, a difference of 0.15%), and Egyptian ($65,441, a difference of 0.18%).
| Demographics | Rating | Rank | Householder Income Over 65 years |
| Marshallese | 99.4 /100 | #63 | Exceptional $65,874 |
| Zimbabweans | 99.4 /100 | #64 | Exceptional $65,854 |
| Immigrants | England | 99.3 /100 | #65 | Exceptional $65,715 |
| South Africans | 99.3 /100 | #66 | Exceptional $65,652 |
| Immigrants | Malaysia | 99.1 /100 | #67 | Exceptional $65,497 |
| Egyptians | 99.1 /100 | #68 | Exceptional $65,441 |
| Samoans | 99.1 /100 | #69 | Exceptional $65,427 |
| Mongolians | 99.0 /100 | #70 | Exceptional $65,326 |
| Greeks | 98.9 /100 | #71 | Exceptional $65,306 |
| Argentineans | 98.9 /100 | #72 | Exceptional $65,246 |
| Immigrants | Ethiopia | 98.9 /100 | #73 | Exceptional $65,238 |
| Lithuanians | 98.8 /100 | #74 | Exceptional $65,209 |
| Sierra Leoneans | 98.6 /100 | #75 | Exceptional $65,038 |
| Ethiopians | 98.5 /100 | #76 | Exceptional $64,989 |
| Immigrants | Canada | 98.5 /100 | #77 | Exceptional $64,952 |
Demographics Similar to Pima by Householder Income Over 65 years
In terms of householder income over 65 years, the demographic groups most similar to Pima are Dutch West Indian ($50,475, a difference of 0.13%), Immigrants from Grenada ($50,747, a difference of 0.41%), Black/African American ($50,779, a difference of 0.47%), Hopi ($50,925, a difference of 0.76%), and Bahamian ($51,000, a difference of 0.91%).
| Demographics | Rating | Rank | Householder Income Over 65 years |
| Immigrants | Congo | 0.0 /100 | #324 | Tragic $51,393 |
| Immigrants | Haiti | 0.0 /100 | #325 | Tragic $51,219 |
| Kiowa | 0.0 /100 | #326 | Tragic $51,140 |
| Bahamians | 0.0 /100 | #327 | Tragic $51,000 |
| Hopi | 0.0 /100 | #328 | Tragic $50,925 |
| Blacks/African Americans | 0.0 /100 | #329 | Tragic $50,779 |
| Immigrants | Grenada | 0.0 /100 | #330 | Tragic $50,747 |
| Pima | 0.0 /100 | #331 | Tragic $50,539 |
| Dutch West Indians | 0.0 /100 | #332 | Tragic $50,475 |
| Cape Verdeans | 0.0 /100 | #333 | Tragic $50,077 |
| Immigrants | Dominica | 0.0 /100 | #334 | Tragic $50,071 |
| Crow | 0.0 /100 | #335 | Tragic $49,234 |
| Cubans | 0.0 /100 | #336 | Tragic $49,152 |
| Tohono O'odham | 0.0 /100 | #337 | Tragic $49,121 |
| Immigrants | Caribbean | 0.0 /100 | #338 | Tragic $48,535 |