Guamanian/Chamorro vs Aleut Householder Income Over 65 years
COMPARE
Guamanian/Chamorro
Aleut
Householder Income Over 65 years
Householder Income Over 65 years Comparison
Guamanians/Chamorros
Aleuts
$63,187
HOUSEHOLDER INCOME OVER 65 YEARS
91.1/ 100
METRIC RATING
116th/ 347
METRIC RANK
$62,708
HOUSEHOLDER INCOME OVER 65 YEARS
86.1/ 100
METRIC RATING
128th/ 347
METRIC RANK
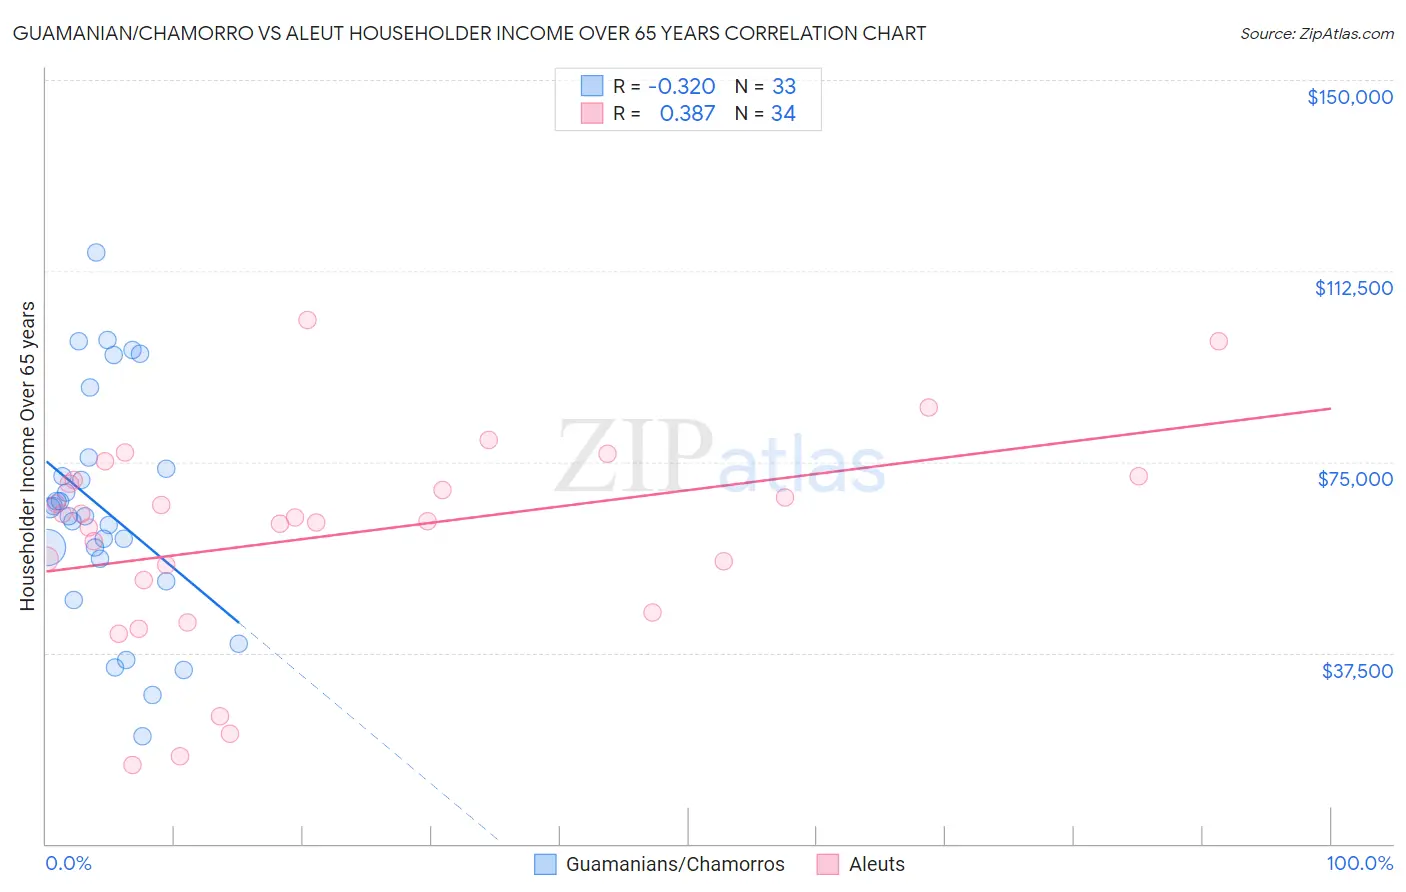
Guamanian/Chamorro vs Aleut Householder Income Over 65 years Correlation Chart
The statistical analysis conducted on geographies consisting of 221,091,968 people shows a mild negative correlation between the proportion of Guamanians/Chamorros and household income with householder over the age of 65 in the United States with a correlation coefficient (R) of -0.320 and weighted average of $63,187. Similarly, the statistical analysis conducted on geographies consisting of 61,728,641 people shows a mild positive correlation between the proportion of Aleuts and household income with householder over the age of 65 in the United States with a correlation coefficient (R) of 0.387 and weighted average of $62,708, a difference of 0.76%.
Householder Income Over 65 years Correlation Summary
| Measurement | Guamanian/Chamorro | Aleut |
| Minimum | $21,071 | $15,500 |
| Maximum | $116,094 | $102,955 |
| Range | $95,023 | $87,455 |
| Mean | $65,533 | $60,420 |
| Median | $64,389 | $63,750 |
| Interquartile 25% (IQ1) | $53,785 | $51,897 |
| Interquartile 75% (IQ3) | $74,861 | $71,452 |
| Interquartile Range (IQR) | $21,076 | $19,555 |
| Standard Deviation (Sample) | $22,403 | $20,386 |
| Standard Deviation (Population) | $22,061 | $20,084 |
Demographics Similar to Guamanians/Chamorros and Aleuts by Householder Income Over 65 years
In terms of householder income over 65 years, the demographic groups most similar to Guamanians/Chamorros are Immigrants from Croatia ($63,168, a difference of 0.030%), Croatian ($63,225, a difference of 0.060%), Danish ($63,117, a difference of 0.11%), Immigrants from Jordan ($63,041, a difference of 0.23%), and Ukrainian ($63,032, a difference of 0.25%). Similarly, the demographic groups most similar to Aleuts are Immigrants from Eastern Europe ($62,693, a difference of 0.020%), Swedish ($62,736, a difference of 0.040%), Peruvian ($62,766, a difference of 0.090%), Basque ($62,653, a difference of 0.090%), and Immigrants from Western Asia ($62,645, a difference of 0.10%).
| Demographics | Rating | Rank | Householder Income Over 65 years |
| Syrians | 93.4 /100 | #112 | Exceptional $63,494 |
| Immigrants | Serbia | 92.7 /100 | #113 | Exceptional $63,387 |
| Immigrants | Saudi Arabia | 92.4 /100 | #114 | Exceptional $63,355 |
| Croatians | 91.4 /100 | #115 | Exceptional $63,225 |
| Guamanians/Chamorros | 91.1 /100 | #116 | Exceptional $63,187 |
| Immigrants | Croatia | 90.9 /100 | #117 | Exceptional $63,168 |
| Danes | 90.5 /100 | #118 | Exceptional $63,117 |
| Immigrants | Jordan | 89.8 /100 | #119 | Excellent $63,041 |
| Ukrainians | 89.7 /100 | #120 | Excellent $63,032 |
| Immigrants | Vietnam | 89.5 /100 | #121 | Excellent $63,014 |
| Immigrants | Moldova | 88.7 /100 | #122 | Excellent $62,939 |
| Tlingit-Haida | 88.6 /100 | #123 | Excellent $62,922 |
| Taiwanese | 88.3 /100 | #124 | Excellent $62,894 |
| Soviet Union | 87.8 /100 | #125 | Excellent $62,848 |
| Peruvians | 86.8 /100 | #126 | Excellent $62,766 |
| Swedes | 86.4 /100 | #127 | Excellent $62,736 |
| Aleuts | 86.1 /100 | #128 | Excellent $62,708 |
| Immigrants | Eastern Europe | 85.9 /100 | #129 | Excellent $62,693 |
| Basques | 85.4 /100 | #130 | Excellent $62,653 |
| Immigrants | Western Asia | 85.3 /100 | #131 | Excellent $62,645 |
| Immigrants | Germany | 83.9 /100 | #132 | Excellent $62,544 |