Guamanian/Chamorro vs Yuman Householder Income Over 65 years
COMPARE
Guamanian/Chamorro
Yuman
Householder Income Over 65 years
Householder Income Over 65 years Comparison
Guamanians/Chamorros
Yuman
$63,187
HOUSEHOLDER INCOME OVER 65 YEARS
91.1/ 100
METRIC RATING
116th/ 347
METRIC RANK
$53,110
HOUSEHOLDER INCOME OVER 65 YEARS
0.0/ 100
METRIC RATING
301st/ 347
METRIC RANK
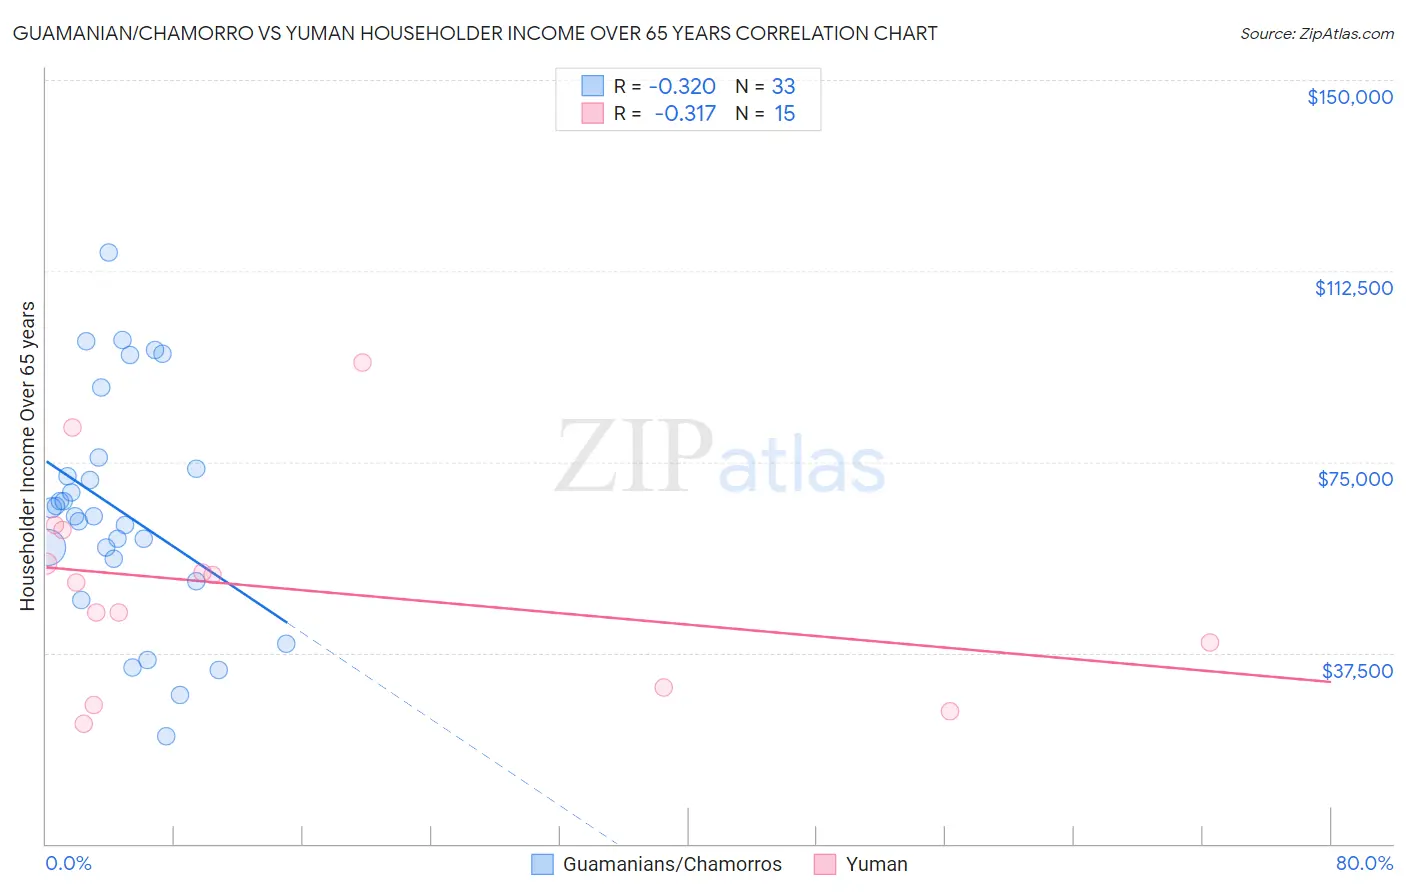
Guamanian/Chamorro vs Yuman Householder Income Over 65 years Correlation Chart
The statistical analysis conducted on geographies consisting of 221,091,968 people shows a mild negative correlation between the proportion of Guamanians/Chamorros and household income with householder over the age of 65 in the United States with a correlation coefficient (R) of -0.320 and weighted average of $63,187. Similarly, the statistical analysis conducted on geographies consisting of 40,575,532 people shows a mild negative correlation between the proportion of Yuman and household income with householder over the age of 65 in the United States with a correlation coefficient (R) of -0.317 and weighted average of $53,110, a difference of 19.0%.
Householder Income Over 65 years Correlation Summary
| Measurement | Guamanian/Chamorro | Yuman |
| Minimum | $21,071 | $23,487 |
| Maximum | $116,094 | $94,583 |
| Range | $95,023 | $71,096 |
| Mean | $65,533 | $50,051 |
| Median | $64,389 | $51,214 |
| Interquartile 25% (IQ1) | $53,785 | $30,588 |
| Interquartile 75% (IQ3) | $74,861 | $61,733 |
| Interquartile Range (IQR) | $21,076 | $31,145 |
| Standard Deviation (Sample) | $22,403 | $20,083 |
| Standard Deviation (Population) | $22,061 | $19,402 |
Similar Demographics by Householder Income Over 65 years
Demographics Similar to Guamanians/Chamorros by Householder Income Over 65 years
In terms of householder income over 65 years, the demographic groups most similar to Guamanians/Chamorros are Immigrants from Croatia ($63,168, a difference of 0.030%), Croatian ($63,225, a difference of 0.060%), Danish ($63,117, a difference of 0.11%), Immigrants from Jordan ($63,041, a difference of 0.23%), and Ukrainian ($63,032, a difference of 0.25%).
| Demographics | Rating | Rank | Householder Income Over 65 years |
| Europeans | 95.0 /100 | #109 | Exceptional $63,779 |
| Immigrants | Zimbabwe | 94.3 /100 | #110 | Exceptional $63,643 |
| Immigrants | Spain | 93.7 /100 | #111 | Exceptional $63,540 |
| Syrians | 93.4 /100 | #112 | Exceptional $63,494 |
| Immigrants | Serbia | 92.7 /100 | #113 | Exceptional $63,387 |
| Immigrants | Saudi Arabia | 92.4 /100 | #114 | Exceptional $63,355 |
| Croatians | 91.4 /100 | #115 | Exceptional $63,225 |
| Guamanians/Chamorros | 91.1 /100 | #116 | Exceptional $63,187 |
| Immigrants | Croatia | 90.9 /100 | #117 | Exceptional $63,168 |
| Danes | 90.5 /100 | #118 | Exceptional $63,117 |
| Immigrants | Jordan | 89.8 /100 | #119 | Excellent $63,041 |
| Ukrainians | 89.7 /100 | #120 | Excellent $63,032 |
| Immigrants | Vietnam | 89.5 /100 | #121 | Excellent $63,014 |
| Immigrants | Moldova | 88.7 /100 | #122 | Excellent $62,939 |
| Tlingit-Haida | 88.6 /100 | #123 | Excellent $62,922 |
Demographics Similar to Yuman by Householder Income Over 65 years
In terms of householder income over 65 years, the demographic groups most similar to Yuman are Spanish American Indian ($53,077, a difference of 0.060%), Choctaw ($53,060, a difference of 0.090%), Immigrants from Bahamas ($53,174, a difference of 0.12%), Ottawa ($53,217, a difference of 0.20%), and Central American Indian ($53,232, a difference of 0.23%).
| Demographics | Rating | Rank | Householder Income Over 65 years |
| Senegalese | 0.0 /100 | #294 | Tragic $53,591 |
| Immigrants | Central America | 0.0 /100 | #295 | Tragic $53,420 |
| Immigrants | Somalia | 0.0 /100 | #296 | Tragic $53,333 |
| Immigrants | Latin America | 0.0 /100 | #297 | Tragic $53,265 |
| Central American Indians | 0.0 /100 | #298 | Tragic $53,232 |
| Ottawa | 0.0 /100 | #299 | Tragic $53,217 |
| Immigrants | Bahamas | 0.0 /100 | #300 | Tragic $53,174 |
| Yuman | 0.0 /100 | #301 | Tragic $53,110 |
| Spanish American Indians | 0.0 /100 | #302 | Tragic $53,077 |
| Choctaw | 0.0 /100 | #303 | Tragic $53,060 |
| Ute | 0.0 /100 | #304 | Tragic $52,949 |
| Pueblo | 0.0 /100 | #305 | Tragic $52,930 |
| Pennsylvania Germans | 0.0 /100 | #306 | Tragic $52,888 |
| Hispanics or Latinos | 0.0 /100 | #307 | Tragic $52,832 |
| Immigrants | Mexico | 0.0 /100 | #308 | Tragic $52,801 |