Guamanian/Chamorro vs Blackfeet Householder Income Over 65 years
COMPARE
Guamanian/Chamorro
Blackfeet
Householder Income Over 65 years
Householder Income Over 65 years Comparison
Guamanians/Chamorros
Blackfeet
$63,187
HOUSEHOLDER INCOME OVER 65 YEARS
91.1/ 100
METRIC RATING
116th/ 347
METRIC RANK
$54,029
HOUSEHOLDER INCOME OVER 65 YEARS
0.1/ 100
METRIC RATING
279th/ 347
METRIC RANK
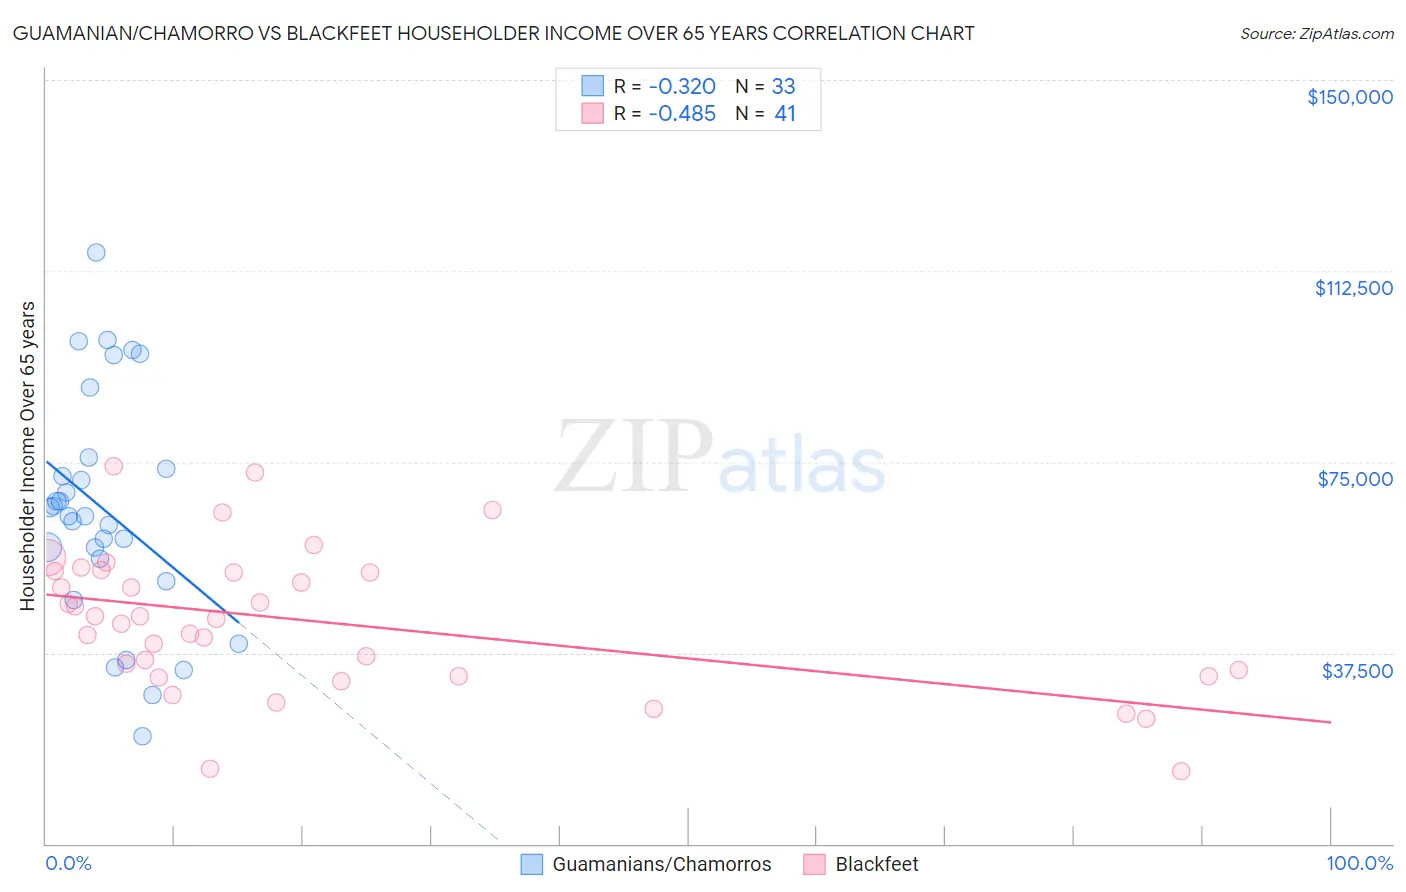
Guamanian/Chamorro vs Blackfeet Householder Income Over 65 years Correlation Chart
The statistical analysis conducted on geographies consisting of 221,091,968 people shows a mild negative correlation between the proportion of Guamanians/Chamorros and household income with householder over the age of 65 in the United States with a correlation coefficient (R) of -0.320 and weighted average of $63,187. Similarly, the statistical analysis conducted on geographies consisting of 308,657,896 people shows a moderate negative correlation between the proportion of Blackfeet and household income with householder over the age of 65 in the United States with a correlation coefficient (R) of -0.485 and weighted average of $54,029, a difference of 17.0%.
Householder Income Over 65 years Correlation Summary
| Measurement | Guamanian/Chamorro | Blackfeet |
| Minimum | $21,071 | $14,196 |
| Maximum | $116,094 | $74,087 |
| Range | $95,023 | $59,891 |
| Mean | $65,533 | $43,504 |
| Median | $64,389 | $44,167 |
| Interquartile 25% (IQ1) | $53,785 | $32,958 |
| Interquartile 75% (IQ3) | $74,861 | $53,466 |
| Interquartile Range (IQR) | $21,076 | $20,508 |
| Standard Deviation (Sample) | $22,403 | $14,024 |
| Standard Deviation (Population) | $22,061 | $13,852 |
Similar Demographics by Householder Income Over 65 years
Demographics Similar to Guamanians/Chamorros by Householder Income Over 65 years
In terms of householder income over 65 years, the demographic groups most similar to Guamanians/Chamorros are Immigrants from Croatia ($63,168, a difference of 0.030%), Croatian ($63,225, a difference of 0.060%), Danish ($63,117, a difference of 0.11%), Immigrants from Jordan ($63,041, a difference of 0.23%), and Ukrainian ($63,032, a difference of 0.25%).
| Demographics | Rating | Rank | Householder Income Over 65 years |
| Europeans | 95.0 /100 | #109 | Exceptional $63,779 |
| Immigrants | Zimbabwe | 94.3 /100 | #110 | Exceptional $63,643 |
| Immigrants | Spain | 93.7 /100 | #111 | Exceptional $63,540 |
| Syrians | 93.4 /100 | #112 | Exceptional $63,494 |
| Immigrants | Serbia | 92.7 /100 | #113 | Exceptional $63,387 |
| Immigrants | Saudi Arabia | 92.4 /100 | #114 | Exceptional $63,355 |
| Croatians | 91.4 /100 | #115 | Exceptional $63,225 |
| Guamanians/Chamorros | 91.1 /100 | #116 | Exceptional $63,187 |
| Immigrants | Croatia | 90.9 /100 | #117 | Exceptional $63,168 |
| Danes | 90.5 /100 | #118 | Exceptional $63,117 |
| Immigrants | Jordan | 89.8 /100 | #119 | Excellent $63,041 |
| Ukrainians | 89.7 /100 | #120 | Excellent $63,032 |
| Immigrants | Vietnam | 89.5 /100 | #121 | Excellent $63,014 |
| Immigrants | Moldova | 88.7 /100 | #122 | Excellent $62,939 |
| Tlingit-Haida | 88.6 /100 | #123 | Excellent $62,922 |
Demographics Similar to Blackfeet by Householder Income Over 65 years
In terms of householder income over 65 years, the demographic groups most similar to Blackfeet are Immigrants from Ecuador ($54,030, a difference of 0.0%), Immigrants from Jamaica ($54,027, a difference of 0.0%), Somali ($54,004, a difference of 0.050%), Immigrants from Armenia ($53,974, a difference of 0.10%), and Cheyenne ($54,096, a difference of 0.12%).
| Demographics | Rating | Rank | Householder Income Over 65 years |
| Potawatomi | 0.1 /100 | #272 | Tragic $54,212 |
| Indonesians | 0.1 /100 | #273 | Tragic $54,176 |
| Barbadians | 0.1 /100 | #274 | Tragic $54,163 |
| Cherokee | 0.1 /100 | #275 | Tragic $54,133 |
| Cree | 0.1 /100 | #276 | Tragic $54,129 |
| Cheyenne | 0.1 /100 | #277 | Tragic $54,096 |
| Immigrants | Ecuador | 0.1 /100 | #278 | Tragic $54,030 |
| Blackfeet | 0.1 /100 | #279 | Tragic $54,029 |
| Immigrants | Jamaica | 0.1 /100 | #280 | Tragic $54,027 |
| Somalis | 0.1 /100 | #281 | Tragic $54,004 |
| Immigrants | Armenia | 0.1 /100 | #282 | Tragic $53,974 |
| Immigrants | Liberia | 0.1 /100 | #283 | Tragic $53,967 |
| Immigrants | Guatemala | 0.1 /100 | #284 | Tragic $53,950 |
| Mexicans | 0.1 /100 | #285 | Tragic $53,897 |
| Chippewa | 0.1 /100 | #286 | Tragic $53,847 |