Guamanian/Chamorro vs Immigrants from Somalia Householder Income Over 65 years
COMPARE
Guamanian/Chamorro
Immigrants from Somalia
Householder Income Over 65 years
Householder Income Over 65 years Comparison
Guamanians/Chamorros
Immigrants from Somalia
$63,187
HOUSEHOLDER INCOME OVER 65 YEARS
91.1/ 100
METRIC RATING
116th/ 347
METRIC RANK
$53,333
HOUSEHOLDER INCOME OVER 65 YEARS
0.0/ 100
METRIC RATING
296th/ 347
METRIC RANK
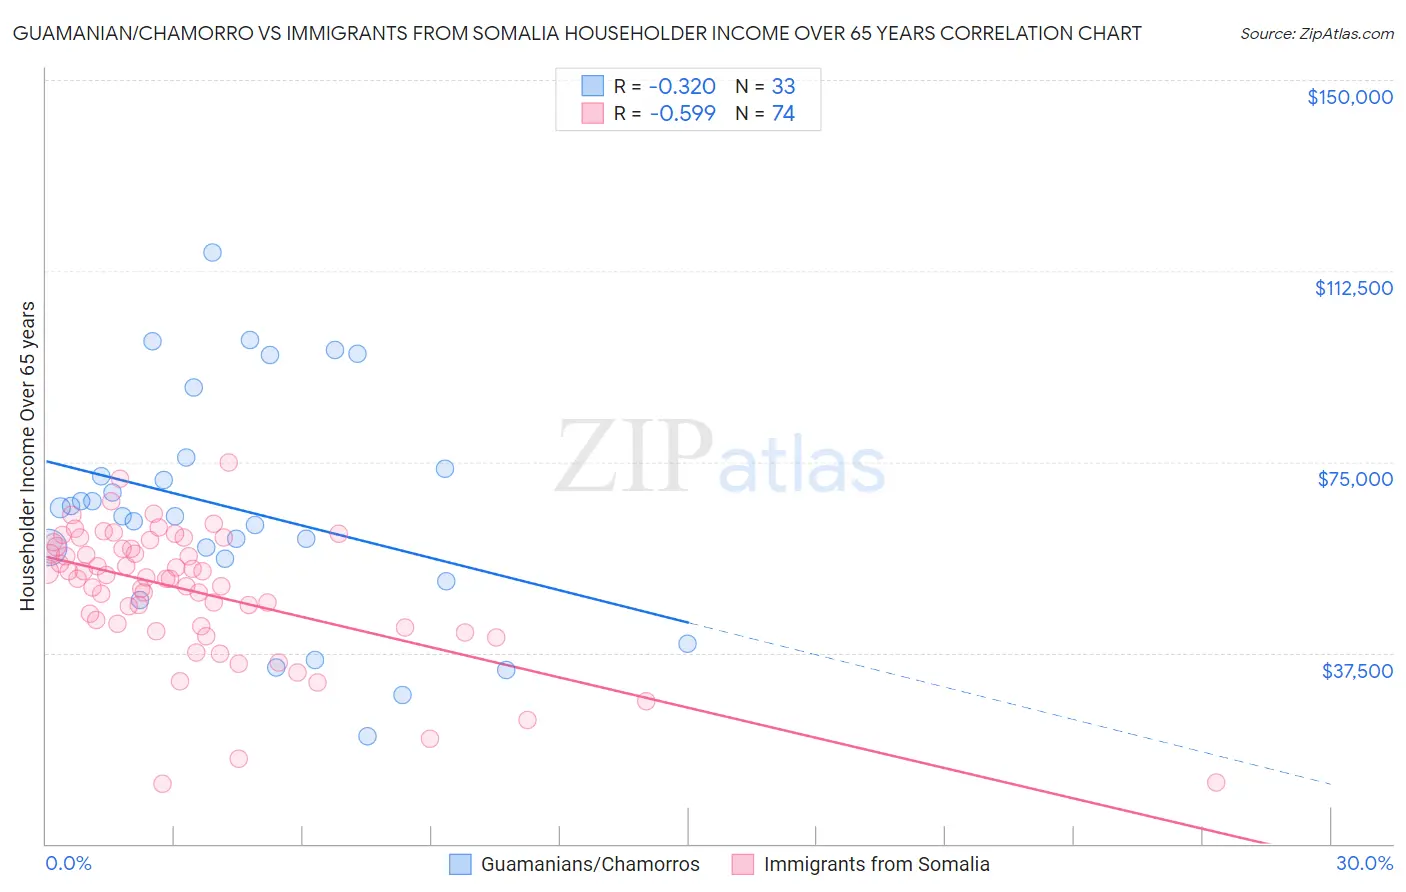
Guamanian/Chamorro vs Immigrants from Somalia Householder Income Over 65 years Correlation Chart
The statistical analysis conducted on geographies consisting of 221,091,968 people shows a mild negative correlation between the proportion of Guamanians/Chamorros and household income with householder over the age of 65 in the United States with a correlation coefficient (R) of -0.320 and weighted average of $63,187. Similarly, the statistical analysis conducted on geographies consisting of 92,049,552 people shows a substantial negative correlation between the proportion of Immigrants from Somalia and household income with householder over the age of 65 in the United States with a correlation coefficient (R) of -0.599 and weighted average of $53,333, a difference of 18.5%.
Householder Income Over 65 years Correlation Summary
| Measurement | Guamanian/Chamorro | Immigrants from Somalia |
| Minimum | $21,071 | $11,897 |
| Maximum | $116,094 | $75,000 |
| Range | $95,023 | $63,103 |
| Mean | $65,533 | $49,499 |
| Median | $64,389 | $52,194 |
| Interquartile 25% (IQ1) | $53,785 | $42,667 |
| Interquartile 75% (IQ3) | $74,861 | $58,367 |
| Interquartile Range (IQR) | $21,076 | $15,700 |
| Standard Deviation (Sample) | $22,403 | $12,933 |
| Standard Deviation (Population) | $22,061 | $12,845 |
Similar Demographics by Householder Income Over 65 years
Demographics Similar to Guamanians/Chamorros by Householder Income Over 65 years
In terms of householder income over 65 years, the demographic groups most similar to Guamanians/Chamorros are Immigrants from Croatia ($63,168, a difference of 0.030%), Croatian ($63,225, a difference of 0.060%), Danish ($63,117, a difference of 0.11%), Immigrants from Jordan ($63,041, a difference of 0.23%), and Ukrainian ($63,032, a difference of 0.25%).
| Demographics | Rating | Rank | Householder Income Over 65 years |
| Europeans | 95.0 /100 | #109 | Exceptional $63,779 |
| Immigrants | Zimbabwe | 94.3 /100 | #110 | Exceptional $63,643 |
| Immigrants | Spain | 93.7 /100 | #111 | Exceptional $63,540 |
| Syrians | 93.4 /100 | #112 | Exceptional $63,494 |
| Immigrants | Serbia | 92.7 /100 | #113 | Exceptional $63,387 |
| Immigrants | Saudi Arabia | 92.4 /100 | #114 | Exceptional $63,355 |
| Croatians | 91.4 /100 | #115 | Exceptional $63,225 |
| Guamanians/Chamorros | 91.1 /100 | #116 | Exceptional $63,187 |
| Immigrants | Croatia | 90.9 /100 | #117 | Exceptional $63,168 |
| Danes | 90.5 /100 | #118 | Exceptional $63,117 |
| Immigrants | Jordan | 89.8 /100 | #119 | Excellent $63,041 |
| Ukrainians | 89.7 /100 | #120 | Excellent $63,032 |
| Immigrants | Vietnam | 89.5 /100 | #121 | Excellent $63,014 |
| Immigrants | Moldova | 88.7 /100 | #122 | Excellent $62,939 |
| Tlingit-Haida | 88.6 /100 | #123 | Excellent $62,922 |
Demographics Similar to Immigrants from Somalia by Householder Income Over 65 years
In terms of householder income over 65 years, the demographic groups most similar to Immigrants from Somalia are Immigrants from Latin America ($53,265, a difference of 0.13%), Immigrants from Central America ($53,420, a difference of 0.16%), Central American Indian ($53,232, a difference of 0.19%), Ottawa ($53,217, a difference of 0.22%), and Immigrants from Bahamas ($53,174, a difference of 0.30%).
| Demographics | Rating | Rank | Householder Income Over 65 years |
| Iroquois | 0.1 /100 | #289 | Tragic $53,737 |
| Chickasaw | 0.1 /100 | #290 | Tragic $53,732 |
| Africans | 0.0 /100 | #291 | Tragic $53,711 |
| Shoshone | 0.0 /100 | #292 | Tragic $53,681 |
| Immigrants | Belize | 0.0 /100 | #293 | Tragic $53,665 |
| Senegalese | 0.0 /100 | #294 | Tragic $53,591 |
| Immigrants | Central America | 0.0 /100 | #295 | Tragic $53,420 |
| Immigrants | Somalia | 0.0 /100 | #296 | Tragic $53,333 |
| Immigrants | Latin America | 0.0 /100 | #297 | Tragic $53,265 |
| Central American Indians | 0.0 /100 | #298 | Tragic $53,232 |
| Ottawa | 0.0 /100 | #299 | Tragic $53,217 |
| Immigrants | Bahamas | 0.0 /100 | #300 | Tragic $53,174 |
| Yuman | 0.0 /100 | #301 | Tragic $53,110 |
| Spanish American Indians | 0.0 /100 | #302 | Tragic $53,077 |
| Choctaw | 0.0 /100 | #303 | Tragic $53,060 |