Guamanian/Chamorro vs Alaska Native Householder Income Over 65 years
COMPARE
Guamanian/Chamorro
Alaska Native
Householder Income Over 65 years
Householder Income Over 65 years Comparison
Guamanians/Chamorros
Alaska Natives
$63,187
HOUSEHOLDER INCOME OVER 65 YEARS
91.1/ 100
METRIC RATING
116th/ 347
METRIC RANK
$60,748
HOUSEHOLDER INCOME OVER 65 YEARS
44.3/ 100
METRIC RATING
177th/ 347
METRIC RANK
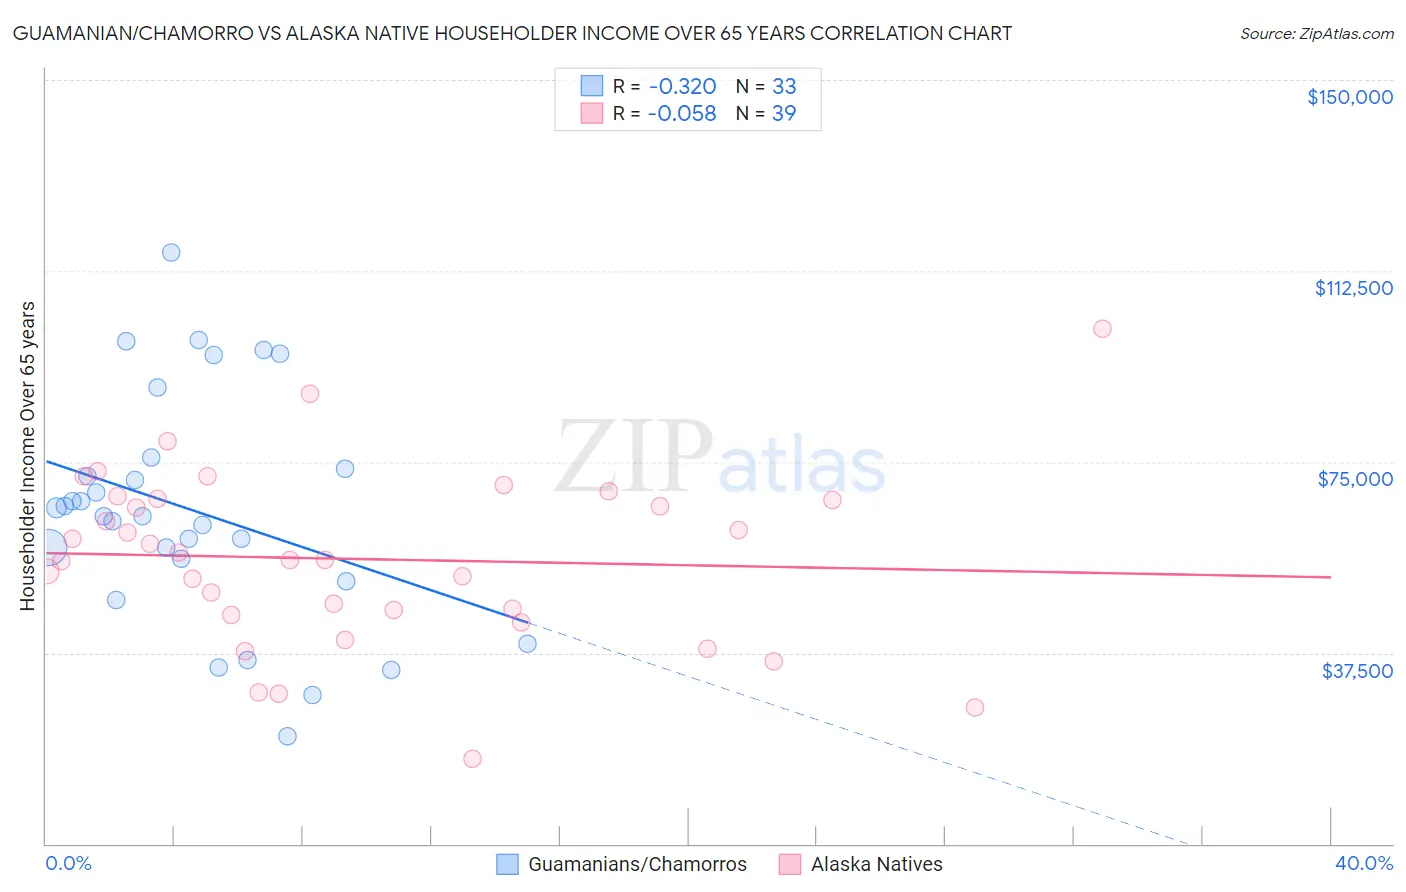
Guamanian/Chamorro vs Alaska Native Householder Income Over 65 years Correlation Chart
The statistical analysis conducted on geographies consisting of 221,091,968 people shows a mild negative correlation between the proportion of Guamanians/Chamorros and household income with householder over the age of 65 in the United States with a correlation coefficient (R) of -0.320 and weighted average of $63,187. Similarly, the statistical analysis conducted on geographies consisting of 76,616,982 people shows a slight negative correlation between the proportion of Alaska Natives and household income with householder over the age of 65 in the United States with a correlation coefficient (R) of -0.058 and weighted average of $60,748, a difference of 4.0%.
Householder Income Over 65 years Correlation Summary
| Measurement | Guamanian/Chamorro | Alaska Native |
| Minimum | $21,071 | $16,607 |
| Maximum | $116,094 | $101,250 |
| Range | $95,023 | $84,643 |
| Mean | $65,533 | $55,918 |
| Median | $64,389 | $55,808 |
| Interquartile 25% (IQ1) | $53,785 | $45,000 |
| Interquartile 75% (IQ3) | $74,861 | $67,644 |
| Interquartile Range (IQR) | $21,076 | $22,644 |
| Standard Deviation (Sample) | $22,403 | $17,265 |
| Standard Deviation (Population) | $22,061 | $17,043 |
Similar Demographics by Householder Income Over 65 years
Demographics Similar to Guamanians/Chamorros by Householder Income Over 65 years
In terms of householder income over 65 years, the demographic groups most similar to Guamanians/Chamorros are Immigrants from Croatia ($63,168, a difference of 0.030%), Croatian ($63,225, a difference of 0.060%), Danish ($63,117, a difference of 0.11%), Immigrants from Jordan ($63,041, a difference of 0.23%), and Ukrainian ($63,032, a difference of 0.25%).
| Demographics | Rating | Rank | Householder Income Over 65 years |
| Europeans | 95.0 /100 | #109 | Exceptional $63,779 |
| Immigrants | Zimbabwe | 94.3 /100 | #110 | Exceptional $63,643 |
| Immigrants | Spain | 93.7 /100 | #111 | Exceptional $63,540 |
| Syrians | 93.4 /100 | #112 | Exceptional $63,494 |
| Immigrants | Serbia | 92.7 /100 | #113 | Exceptional $63,387 |
| Immigrants | Saudi Arabia | 92.4 /100 | #114 | Exceptional $63,355 |
| Croatians | 91.4 /100 | #115 | Exceptional $63,225 |
| Guamanians/Chamorros | 91.1 /100 | #116 | Exceptional $63,187 |
| Immigrants | Croatia | 90.9 /100 | #117 | Exceptional $63,168 |
| Danes | 90.5 /100 | #118 | Exceptional $63,117 |
| Immigrants | Jordan | 89.8 /100 | #119 | Excellent $63,041 |
| Ukrainians | 89.7 /100 | #120 | Excellent $63,032 |
| Immigrants | Vietnam | 89.5 /100 | #121 | Excellent $63,014 |
| Immigrants | Moldova | 88.7 /100 | #122 | Excellent $62,939 |
| Tlingit-Haida | 88.6 /100 | #123 | Excellent $62,922 |
Demographics Similar to Alaska Natives by Householder Income Over 65 years
In terms of householder income over 65 years, the demographic groups most similar to Alaska Natives are Yup'ik ($60,727, a difference of 0.030%), Spanish ($60,795, a difference of 0.080%), Welsh ($60,666, a difference of 0.14%), Immigrants from Morocco ($60,647, a difference of 0.17%), and Spaniard ($60,866, a difference of 0.19%).
| Demographics | Rating | Rank | Householder Income Over 65 years |
| Serbians | 53.1 /100 | #170 | Average $61,087 |
| Inupiat | 52.4 /100 | #171 | Average $61,061 |
| Immigrants | Poland | 51.9 /100 | #172 | Average $61,041 |
| Immigrants | Micronesia | 50.8 /100 | #173 | Average $61,000 |
| Luxembourgers | 50.0 /100 | #174 | Average $60,967 |
| Spaniards | 47.3 /100 | #175 | Average $60,866 |
| Spanish | 45.5 /100 | #176 | Average $60,795 |
| Alaska Natives | 44.3 /100 | #177 | Average $60,748 |
| Yup'ik | 43.7 /100 | #178 | Average $60,727 |
| Welsh | 42.2 /100 | #179 | Average $60,666 |
| Immigrants | Morocco | 41.7 /100 | #180 | Average $60,647 |
| Celtics | 40.7 /100 | #181 | Average $60,608 |
| Czechoslovakians | 40.0 /100 | #182 | Average $60,581 |
| Kenyans | 38.4 /100 | #183 | Fair $60,514 |
| Iraqis | 37.2 /100 | #184 | Fair $60,466 |