Black/African American vs Dutch West Indian Average Family Size
COMPARE
Black/African American
Dutch West Indian
Average Family Size
Average Family Size Comparison
Blacks/African Americans
Dutch West Indians
3.27
AVERAGE FAMILY SIZE
95.7/ 100
METRIC RATING
112th/ 347
METRIC RANK
3.23
AVERAGE FAMILY SIZE
56.9/ 100
METRIC RATING
167th/ 347
METRIC RANK
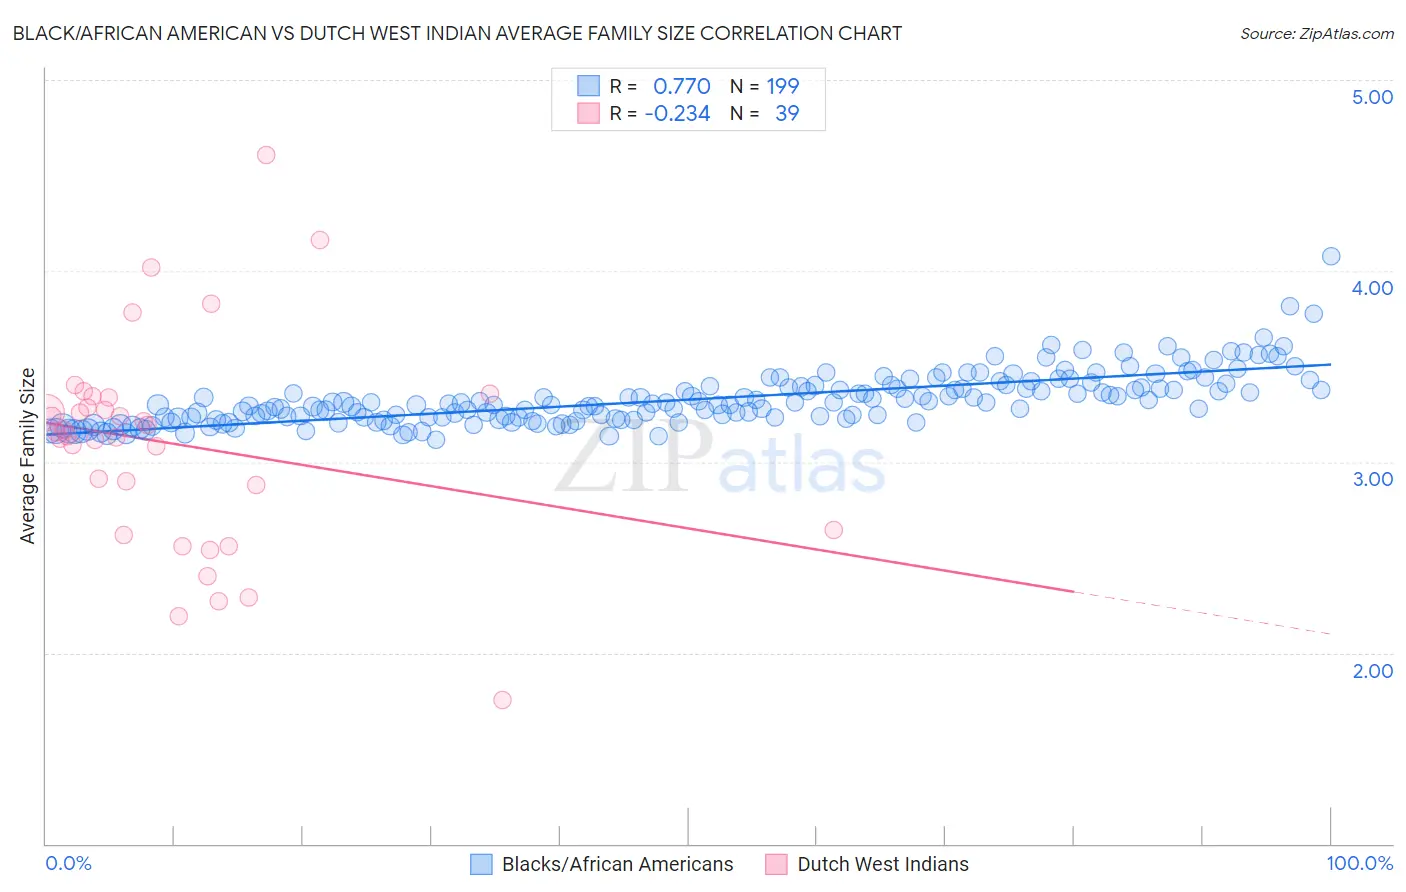
Black/African American vs Dutch West Indian Average Family Size Correlation Chart
The statistical analysis conducted on geographies consisting of 565,344,221 people shows a strong positive correlation between the proportion of Blacks/African Americans and average family size in the United States with a correlation coefficient (R) of 0.770 and weighted average of 3.27. Similarly, the statistical analysis conducted on geographies consisting of 85,766,577 people shows a weak negative correlation between the proportion of Dutch West Indians and average family size in the United States with a correlation coefficient (R) of -0.234 and weighted average of 3.23, a difference of 1.3%.
Average Family Size Correlation Summary
| Measurement | Black/African American | Dutch West Indian |
| Minimum | 3.12 | 1.75 |
| Maximum | 4.08 | 4.61 |
| Range | 0.96 | 2.86 |
| Mean | 3.33 | 3.09 |
| Median | 3.30 | 3.15 |
| Interquartile 25% (IQ1) | 3.23 | 2.64 |
| Interquartile 75% (IQ3) | 3.39 | 3.33 |
| Interquartile Range (IQR) | 0.16 | 0.69 |
| Standard Deviation (Sample) | 0.14 | 0.56 |
| Standard Deviation (Population) | 0.14 | 0.55 |
Similar Demographics by Average Family Size
Demographics Similar to Blacks/African Americans by Average Family Size
In terms of average family size, the demographic groups most similar to Blacks/African Americans are Immigrants from Panama (3.27, a difference of 0.010%), Indonesian (3.28, a difference of 0.060%), South American (3.27, a difference of 0.060%), Immigrants from Liberia (3.27, a difference of 0.070%), and Immigrants from South America (3.27, a difference of 0.070%).
| Demographics | Rating | Rank | Average Family Size |
| Immigrants | Ghana | 98.1 /100 | #105 | Exceptional 3.29 |
| Paiute | 98.0 /100 | #106 | Exceptional 3.29 |
| Ghanaians | 98.0 /100 | #107 | Exceptional 3.29 |
| Asians | 97.0 /100 | #108 | Exceptional 3.28 |
| Puerto Ricans | 96.7 /100 | #109 | Exceptional 3.28 |
| Bahamians | 96.6 /100 | #110 | Exceptional 3.28 |
| Indonesians | 96.2 /100 | #111 | Exceptional 3.28 |
| Blacks/African Americans | 95.7 /100 | #112 | Exceptional 3.27 |
| Immigrants | Panama | 95.6 /100 | #113 | Exceptional 3.27 |
| South Americans | 95.1 /100 | #114 | Exceptional 3.27 |
| Immigrants | Liberia | 95.0 /100 | #115 | Exceptional 3.27 |
| Immigrants | South America | 95.0 /100 | #116 | Exceptional 3.27 |
| Kiowa | 94.8 /100 | #117 | Exceptional 3.27 |
| Immigrants | Asia | 94.0 /100 | #118 | Exceptional 3.27 |
| Immigrants | Indonesia | 93.7 /100 | #119 | Exceptional 3.27 |
Demographics Similar to Dutch West Indians by Average Family Size
In terms of average family size, the demographic groups most similar to Dutch West Indians are Immigrants from Senegal (3.23, a difference of 0.010%), Egyptian (3.23, a difference of 0.030%), Ugandan (3.23, a difference of 0.030%), Uruguayan (3.23, a difference of 0.040%), and Taiwanese (3.23, a difference of 0.050%).
| Demographics | Rating | Rank | Average Family Size |
| Immigrants | Iraq | 63.7 /100 | #160 | Good 3.24 |
| Immigrants | Chile | 63.2 /100 | #161 | Good 3.24 |
| Immigrants | Uganda | 60.1 /100 | #162 | Good 3.23 |
| Uruguayans | 58.8 /100 | #163 | Average 3.23 |
| Egyptians | 58.6 /100 | #164 | Average 3.23 |
| Ugandans | 58.4 /100 | #165 | Average 3.23 |
| Immigrants | Senegal | 57.5 /100 | #166 | Average 3.23 |
| Dutch West Indians | 56.9 /100 | #167 | Average 3.23 |
| Taiwanese | 54.2 /100 | #168 | Average 3.23 |
| Aleuts | 54.1 /100 | #169 | Average 3.23 |
| Arabs | 53.8 /100 | #170 | Average 3.23 |
| Chileans | 53.2 /100 | #171 | Average 3.23 |
| Immigrants | Congo | 52.7 /100 | #172 | Average 3.23 |
| Immigrants | Uruguay | 52.0 /100 | #173 | Average 3.23 |
| Immigrants | South Central Asia | 50.0 /100 | #174 | Average 3.23 |