Native Hawaiian vs Arab Householder Income Over 65 years
COMPARE
Native Hawaiian
Arab
Householder Income Over 65 years
Householder Income Over 65 years Comparison
Native Hawaiians
Arabs
$71,021
HOUSEHOLDER INCOME OVER 65 YEARS
100.0/ 100
METRIC RATING
15th/ 347
METRIC RANK
$62,266
HOUSEHOLDER INCOME OVER 65 YEARS
79.6/ 100
METRIC RATING
140th/ 347
METRIC RANK
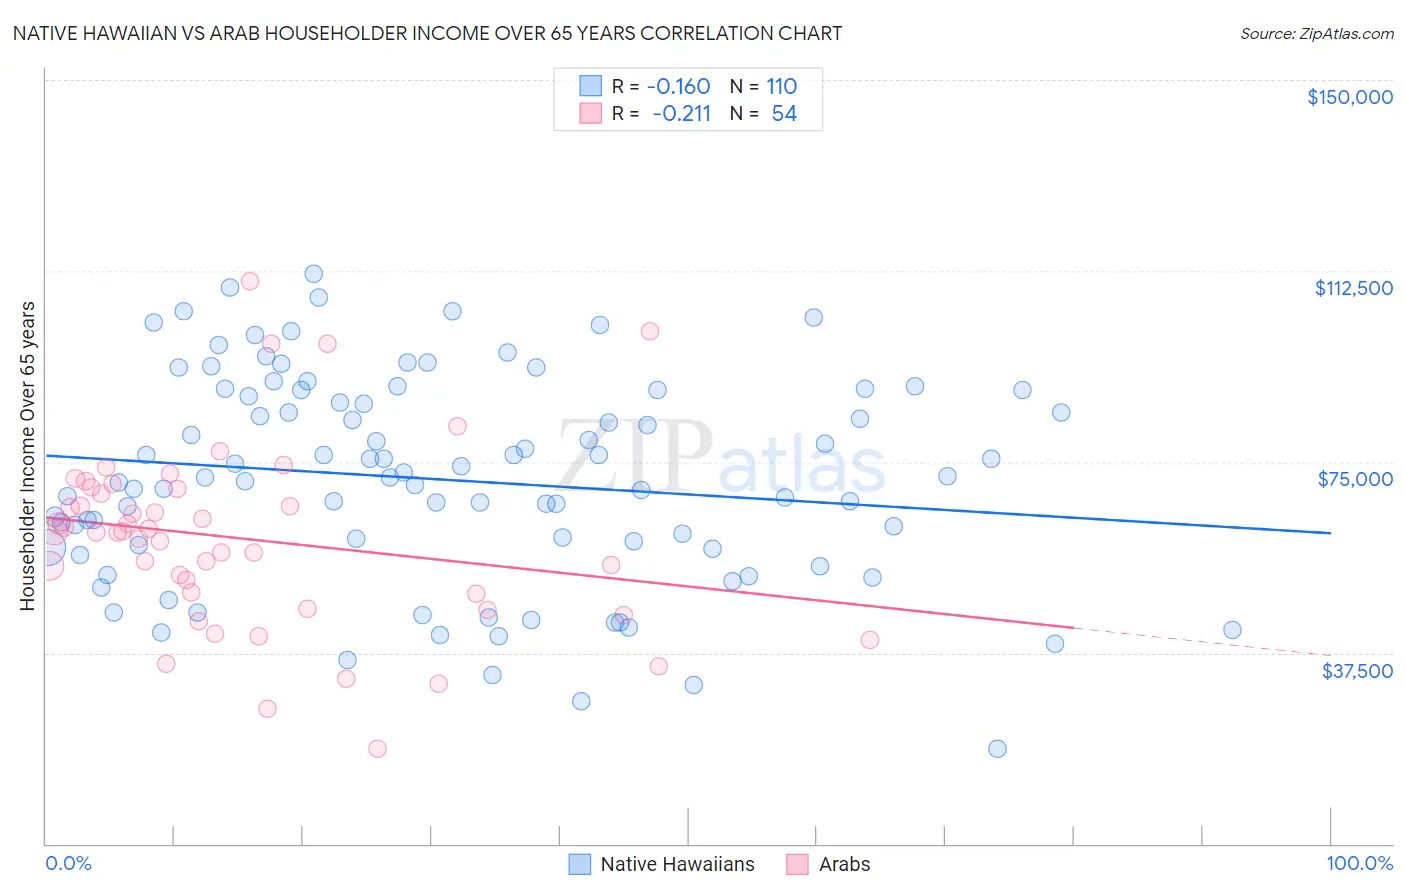
Native Hawaiian vs Arab Householder Income Over 65 years Correlation Chart
The statistical analysis conducted on geographies consisting of 330,764,253 people shows a poor negative correlation between the proportion of Native Hawaiians and household income with householder over the age of 65 in the United States with a correlation coefficient (R) of -0.160 and weighted average of $71,021. Similarly, the statistical analysis conducted on geographies consisting of 484,580,257 people shows a weak negative correlation between the proportion of Arabs and household income with householder over the age of 65 in the United States with a correlation coefficient (R) of -0.211 and weighted average of $62,266, a difference of 14.1%.
Householder Income Over 65 years Correlation Summary
| Measurement | Native Hawaiian | Arab |
| Minimum | $18,720 | $18,625 |
| Maximum | $112,011 | $110,553 |
| Range | $93,291 | $91,928 |
| Mean | $71,470 | $59,915 |
| Median | $71,949 | $61,186 |
| Interquartile 25% (IQ1) | $58,178 | $48,984 |
| Interquartile 75% (IQ3) | $88,994 | $69,644 |
| Interquartile Range (IQR) | $30,816 | $20,660 |
| Standard Deviation (Sample) | $20,453 | $18,146 |
| Standard Deviation (Population) | $20,359 | $17,978 |
Similar Demographics by Householder Income Over 65 years
Demographics Similar to Native Hawaiians by Householder Income Over 65 years
In terms of householder income over 65 years, the demographic groups most similar to Native Hawaiians are Burmese ($71,139, a difference of 0.17%), Okinawan ($70,846, a difference of 0.25%), Immigrants from Korea ($70,696, a difference of 0.46%), Immigrants from Hong Kong ($71,567, a difference of 0.77%), and Eastern European ($70,470, a difference of 0.78%).
| Demographics | Rating | Rank | Householder Income Over 65 years |
| Immigrants | Singapore | 100.0 /100 | #8 | Exceptional $72,963 |
| Immigrants | India | 100.0 /100 | #9 | Exceptional $72,804 |
| Bhutanese | 100.0 /100 | #10 | Exceptional $72,288 |
| Thais | 100.0 /100 | #11 | Exceptional $72,099 |
| Cypriots | 100.0 /100 | #12 | Exceptional $71,714 |
| Immigrants | Hong Kong | 100.0 /100 | #13 | Exceptional $71,567 |
| Burmese | 100.0 /100 | #14 | Exceptional $71,139 |
| Native Hawaiians | 100.0 /100 | #15 | Exceptional $71,021 |
| Okinawans | 100.0 /100 | #16 | Exceptional $70,846 |
| Immigrants | Korea | 100.0 /100 | #17 | Exceptional $70,696 |
| Eastern Europeans | 100.0 /100 | #18 | Exceptional $70,470 |
| Indians (Asian) | 100.0 /100 | #19 | Exceptional $70,238 |
| Immigrants | South Central Asia | 100.0 /100 | #20 | Exceptional $70,103 |
| Immigrants | Eastern Asia | 100.0 /100 | #21 | Exceptional $69,872 |
| Immigrants | Israel | 100.0 /100 | #22 | Exceptional $69,857 |
Demographics Similar to Arabs by Householder Income Over 65 years
In terms of householder income over 65 years, the demographic groups most similar to Arabs are Lebanese ($62,287, a difference of 0.030%), Immigrants from Kazakhstan ($62,292, a difference of 0.040%), Immigrants from Syria ($62,303, a difference of 0.060%), Canadian ($62,230, a difference of 0.060%), and South American Indian ($62,215, a difference of 0.080%).
| Demographics | Rating | Rank | Householder Income Over 65 years |
| Immigrants | Northern Africa | 83.6 /100 | #133 | Excellent $62,522 |
| Immigrants | Brazil | 81.2 /100 | #134 | Excellent $62,364 |
| Immigrants | Chile | 81.0 /100 | #135 | Excellent $62,354 |
| Alaskan Athabascans | 80.6 /100 | #136 | Excellent $62,330 |
| Immigrants | Syria | 80.2 /100 | #137 | Excellent $62,303 |
| Immigrants | Kazakhstan | 80.0 /100 | #138 | Excellent $62,292 |
| Lebanese | 79.9 /100 | #139 | Good $62,287 |
| Arabs | 79.6 /100 | #140 | Good $62,266 |
| Canadians | 79.0 /100 | #141 | Good $62,230 |
| South American Indians | 78.7 /100 | #142 | Good $62,215 |
| Immigrants | Belarus | 77.8 /100 | #143 | Good $62,162 |
| Immigrants | Peru | 74.4 /100 | #144 | Good $61,988 |
| Immigrants | Uganda | 74.2 /100 | #145 | Good $61,976 |
| Immigrants | Southern Europe | 72.7 /100 | #146 | Good $61,902 |
| Immigrants | Nepal | 71.4 /100 | #147 | Good $61,843 |