White/Caucasian vs Nicaraguan Wage/Income Gap
COMPARE
White/Caucasian
Nicaraguan
Wage/Income Gap
Wage/Income Gap Comparison
Whites/Caucasians
Nicaraguans
28.5%
WAGE/INCOME GAP
0.1/ 100
METRIC RATING
306th/ 347
METRIC RANK
23.4%
WAGE/INCOME GAP
99.6/ 100
METRIC RATING
90th/ 347
METRIC RANK
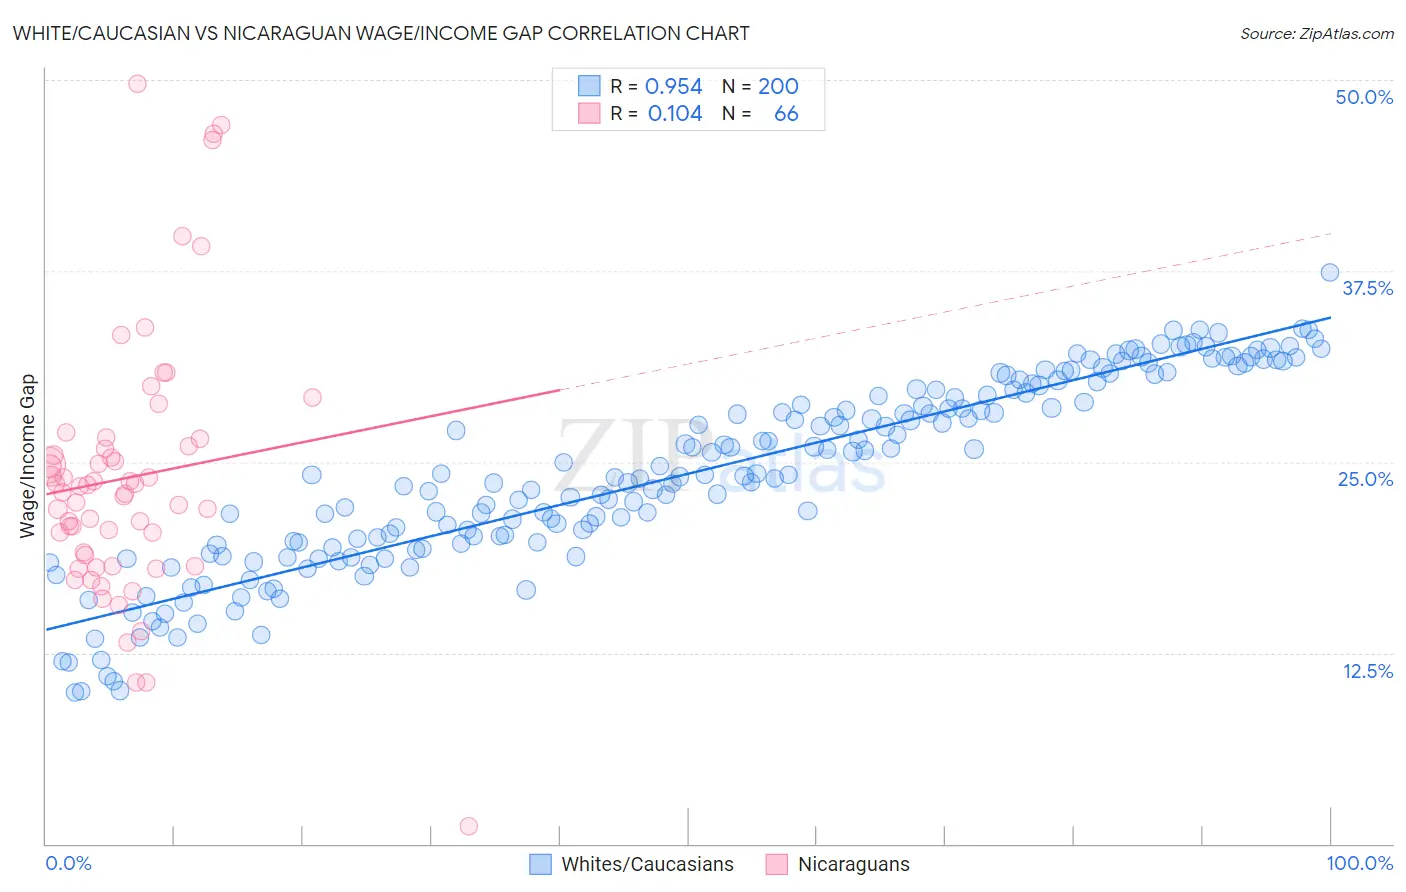
White/Caucasian vs Nicaraguan Wage/Income Gap Correlation Chart
The statistical analysis conducted on geographies consisting of 580,089,064 people shows a perfect positive correlation between the proportion of Whites/Caucasians and wage/income gap percentage in the United States with a correlation coefficient (R) of 0.954 and weighted average of 28.5%. Similarly, the statistical analysis conducted on geographies consisting of 285,636,386 people shows a poor positive correlation between the proportion of Nicaraguans and wage/income gap percentage in the United States with a correlation coefficient (R) of 0.104 and weighted average of 23.4%, a difference of 21.7%.
Wage/Income Gap Correlation Summary
| Measurement | White/Caucasian | Nicaraguan |
| Minimum | 9.9% | 1.2% |
| Maximum | 37.4% | 49.8% |
| Range | 27.5% | 48.6% |
| Mean | 24.2% | 24.0% |
| Median | 24.1% | 23.2% |
| Interquartile 25% (IQ1) | 19.6% | 18.9% |
| Interquartile 75% (IQ3) | 29.7% | 26.0% |
| Interquartile Range (IQR) | 10.1% | 7.1% |
| Standard Deviation (Sample) | 6.2% | 8.6% |
| Standard Deviation (Population) | 6.2% | 8.5% |
Similar Demographics by Wage/Income Gap
Demographics Similar to Whites/Caucasians by Wage/Income Gap
In terms of wage/income gap, the demographic groups most similar to Whites/Caucasians are Immigrants from Denmark (28.5%, a difference of 0.010%), Immigrants from South Africa (28.5%, a difference of 0.050%), Immigrants from Netherlands (28.5%, a difference of 0.060%), Polish (28.5%, a difference of 0.080%), and Scotch-Irish (28.5%, a difference of 0.14%).
| Demographics | Rating | Rank | Wage/Income Gap |
| Immigrants | North Macedonia | 0.2 /100 | #299 | Tragic 28.4% |
| Immigrants | Northern Europe | 0.2 /100 | #300 | Tragic 28.5% |
| Immigrants | Canada | 0.2 /100 | #301 | Tragic 28.5% |
| Scotch-Irish | 0.2 /100 | #302 | Tragic 28.5% |
| Irish | 0.2 /100 | #303 | Tragic 28.5% |
| Immigrants | Netherlands | 0.2 /100 | #304 | Tragic 28.5% |
| Immigrants | South Africa | 0.1 /100 | #305 | Tragic 28.5% |
| Whites/Caucasians | 0.1 /100 | #306 | Tragic 28.5% |
| Immigrants | Denmark | 0.1 /100 | #307 | Tragic 28.5% |
| Poles | 0.1 /100 | #308 | Tragic 28.5% |
| Macedonians | 0.1 /100 | #309 | Tragic 28.6% |
| Finns | 0.1 /100 | #310 | Tragic 28.6% |
| Immigrants | Lithuania | 0.1 /100 | #311 | Tragic 28.6% |
| Eastern Europeans | 0.1 /100 | #312 | Tragic 28.6% |
| French | 0.1 /100 | #313 | Tragic 28.7% |
Demographics Similar to Nicaraguans by Wage/Income Gap
In terms of wage/income gap, the demographic groups most similar to Nicaraguans are Marshallese (23.4%, a difference of 0.010%), Immigrants from Panama (23.4%, a difference of 0.10%), Arapaho (23.5%, a difference of 0.14%), Immigrants from Honduras (23.5%, a difference of 0.29%), and Yuman (23.3%, a difference of 0.42%).
| Demographics | Rating | Rank | Wage/Income Gap |
| Immigrants | Africa | 99.8 /100 | #83 | Exceptional 23.2% |
| Cubans | 99.7 /100 | #84 | Exceptional 23.3% |
| Immigrants | Cambodia | 99.7 /100 | #85 | Exceptional 23.3% |
| Cheyenne | 99.7 /100 | #86 | Exceptional 23.3% |
| Yuman | 99.7 /100 | #87 | Exceptional 23.3% |
| Immigrants | Panama | 99.6 /100 | #88 | Exceptional 23.4% |
| Marshallese | 99.6 /100 | #89 | Exceptional 23.4% |
| Nicaraguans | 99.6 /100 | #90 | Exceptional 23.4% |
| Arapaho | 99.6 /100 | #91 | Exceptional 23.5% |
| Immigrants | Honduras | 99.5 /100 | #92 | Exceptional 23.5% |
| Immigrants | Cabo Verde | 99.5 /100 | #93 | Exceptional 23.6% |
| Hondurans | 99.5 /100 | #94 | Exceptional 23.6% |
| Cape Verdeans | 99.4 /100 | #95 | Exceptional 23.6% |
| Kiowa | 99.4 /100 | #96 | Exceptional 23.6% |
| Immigrants | Sudan | 99.4 /100 | #97 | Exceptional 23.6% |