Central American Indian vs Nicaraguan Wage/Income Gap
COMPARE
Central American Indian
Nicaraguan
Wage/Income Gap
Wage/Income Gap Comparison
Central American Indians
Nicaraguans
22.7%
WAGE/INCOME GAP
99.9/ 100
METRIC RATING
66th/ 347
METRIC RANK
23.4%
WAGE/INCOME GAP
99.6/ 100
METRIC RATING
90th/ 347
METRIC RANK
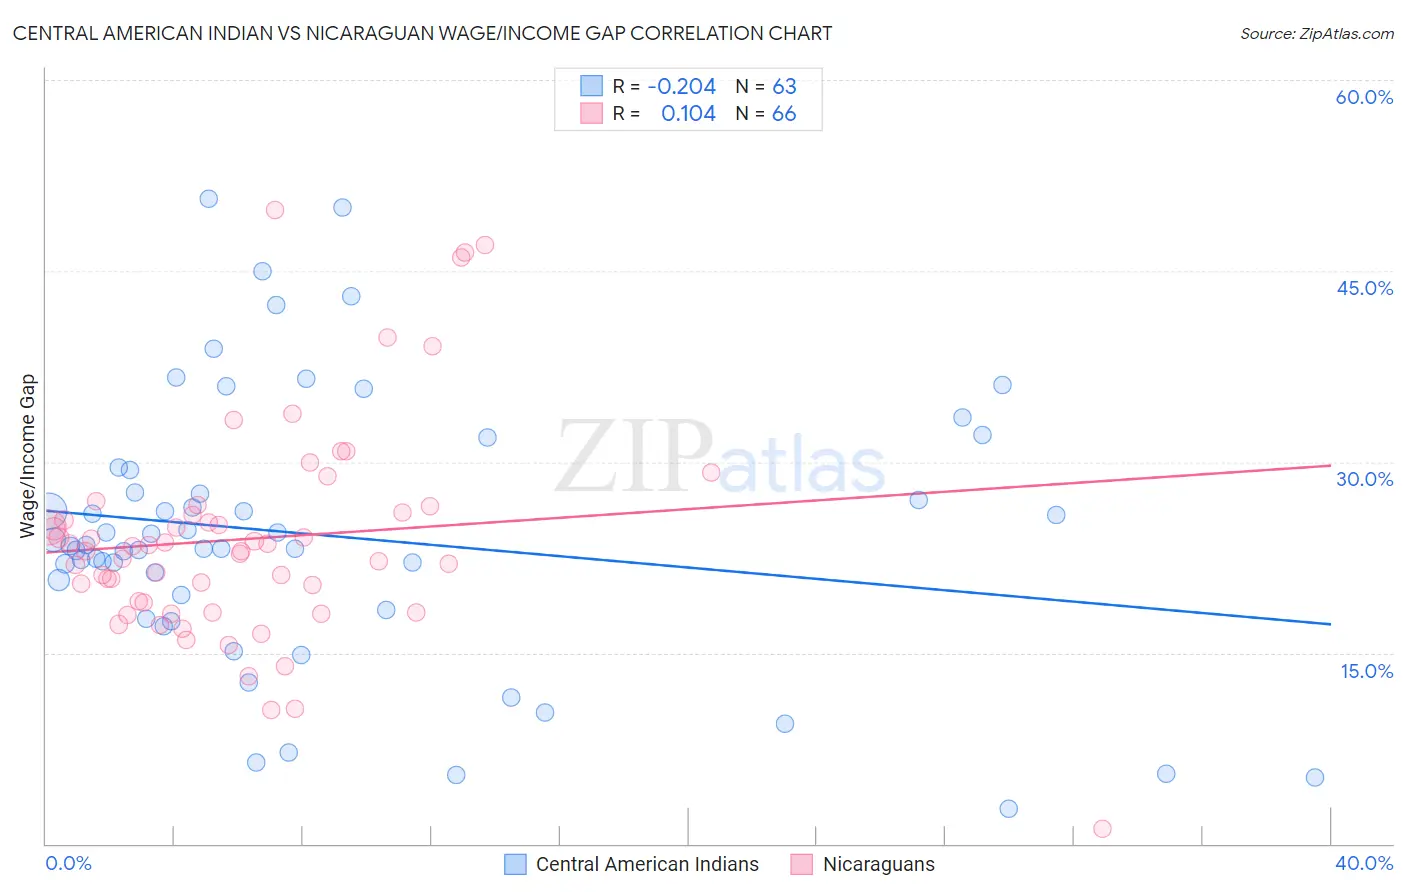
Central American Indian vs Nicaraguan Wage/Income Gap Correlation Chart
The statistical analysis conducted on geographies consisting of 325,982,547 people shows a weak negative correlation between the proportion of Central American Indians and wage/income gap percentage in the United States with a correlation coefficient (R) of -0.204 and weighted average of 22.7%. Similarly, the statistical analysis conducted on geographies consisting of 285,636,386 people shows a poor positive correlation between the proportion of Nicaraguans and wage/income gap percentage in the United States with a correlation coefficient (R) of 0.104 and weighted average of 23.4%, a difference of 3.3%.
Wage/Income Gap Correlation Summary
| Measurement | Central American Indian | Nicaraguan |
| Minimum | 2.8% | 1.2% |
| Maximum | 50.6% | 49.8% |
| Range | 47.9% | 48.6% |
| Mean | 24.2% | 24.0% |
| Median | 23.4% | 23.2% |
| Interquartile 25% (IQ1) | 18.4% | 18.9% |
| Interquartile 75% (IQ3) | 29.3% | 26.0% |
| Interquartile Range (IQR) | 11.0% | 7.1% |
| Standard Deviation (Sample) | 10.6% | 8.6% |
| Standard Deviation (Population) | 10.5% | 8.5% |
Similar Demographics by Wage/Income Gap
Demographics Similar to Central American Indians by Wage/Income Gap
In terms of wage/income gap, the demographic groups most similar to Central American Indians are Menominee (22.7%, a difference of 0.17%), Immigrants from Nigeria (22.7%, a difference of 0.18%), Indonesian (22.7%, a difference of 0.21%), Guatemalan (22.6%, a difference of 0.24%), and Immigrants from Uzbekistan (22.7%, a difference of 0.32%).
| Demographics | Rating | Rank | Wage/Income Gap |
| Navajo | 100.0 /100 | #59 | Exceptional 22.4% |
| Immigrants | Middle Africa | 100.0 /100 | #60 | Exceptional 22.4% |
| Immigrants | Fiji | 100.0 /100 | #61 | Exceptional 22.4% |
| Immigrants | Guatemala | 100.0 /100 | #62 | Exceptional 22.5% |
| Immigrants | Ecuador | 100.0 /100 | #63 | Exceptional 22.5% |
| Spanish American Indians | 100.0 /100 | #64 | Exceptional 22.5% |
| Guatemalans | 99.9 /100 | #65 | Exceptional 22.6% |
| Central American Indians | 99.9 /100 | #66 | Exceptional 22.7% |
| Menominee | 99.9 /100 | #67 | Exceptional 22.7% |
| Immigrants | Nigeria | 99.9 /100 | #68 | Exceptional 22.7% |
| Indonesians | 99.9 /100 | #69 | Exceptional 22.7% |
| Immigrants | Uzbekistan | 99.9 /100 | #70 | Exceptional 22.7% |
| Immigrants | El Salvador | 99.9 /100 | #71 | Exceptional 22.8% |
| Sub-Saharan Africans | 99.9 /100 | #72 | Exceptional 22.8% |
| Immigrants | Eastern Africa | 99.9 /100 | #73 | Exceptional 22.8% |
Demographics Similar to Nicaraguans by Wage/Income Gap
In terms of wage/income gap, the demographic groups most similar to Nicaraguans are Marshallese (23.4%, a difference of 0.010%), Immigrants from Panama (23.4%, a difference of 0.10%), Arapaho (23.5%, a difference of 0.14%), Immigrants from Honduras (23.5%, a difference of 0.29%), and Yuman (23.3%, a difference of 0.42%).
| Demographics | Rating | Rank | Wage/Income Gap |
| Immigrants | Africa | 99.8 /100 | #83 | Exceptional 23.2% |
| Cubans | 99.7 /100 | #84 | Exceptional 23.3% |
| Immigrants | Cambodia | 99.7 /100 | #85 | Exceptional 23.3% |
| Cheyenne | 99.7 /100 | #86 | Exceptional 23.3% |
| Yuman | 99.7 /100 | #87 | Exceptional 23.3% |
| Immigrants | Panama | 99.6 /100 | #88 | Exceptional 23.4% |
| Marshallese | 99.6 /100 | #89 | Exceptional 23.4% |
| Nicaraguans | 99.6 /100 | #90 | Exceptional 23.4% |
| Arapaho | 99.6 /100 | #91 | Exceptional 23.5% |
| Immigrants | Honduras | 99.5 /100 | #92 | Exceptional 23.5% |
| Immigrants | Cabo Verde | 99.5 /100 | #93 | Exceptional 23.6% |
| Hondurans | 99.5 /100 | #94 | Exceptional 23.6% |
| Cape Verdeans | 99.4 /100 | #95 | Exceptional 23.6% |
| Kiowa | 99.4 /100 | #96 | Exceptional 23.6% |
| Immigrants | Sudan | 99.4 /100 | #97 | Exceptional 23.6% |